29
/
en
AIzaSyAYiBZKx7MnpbEhh9jyipgxe19OcubqV5w
April 1, 2024
34714
Heavily indebted poor countries (HIPC)
HPC
false
2
1
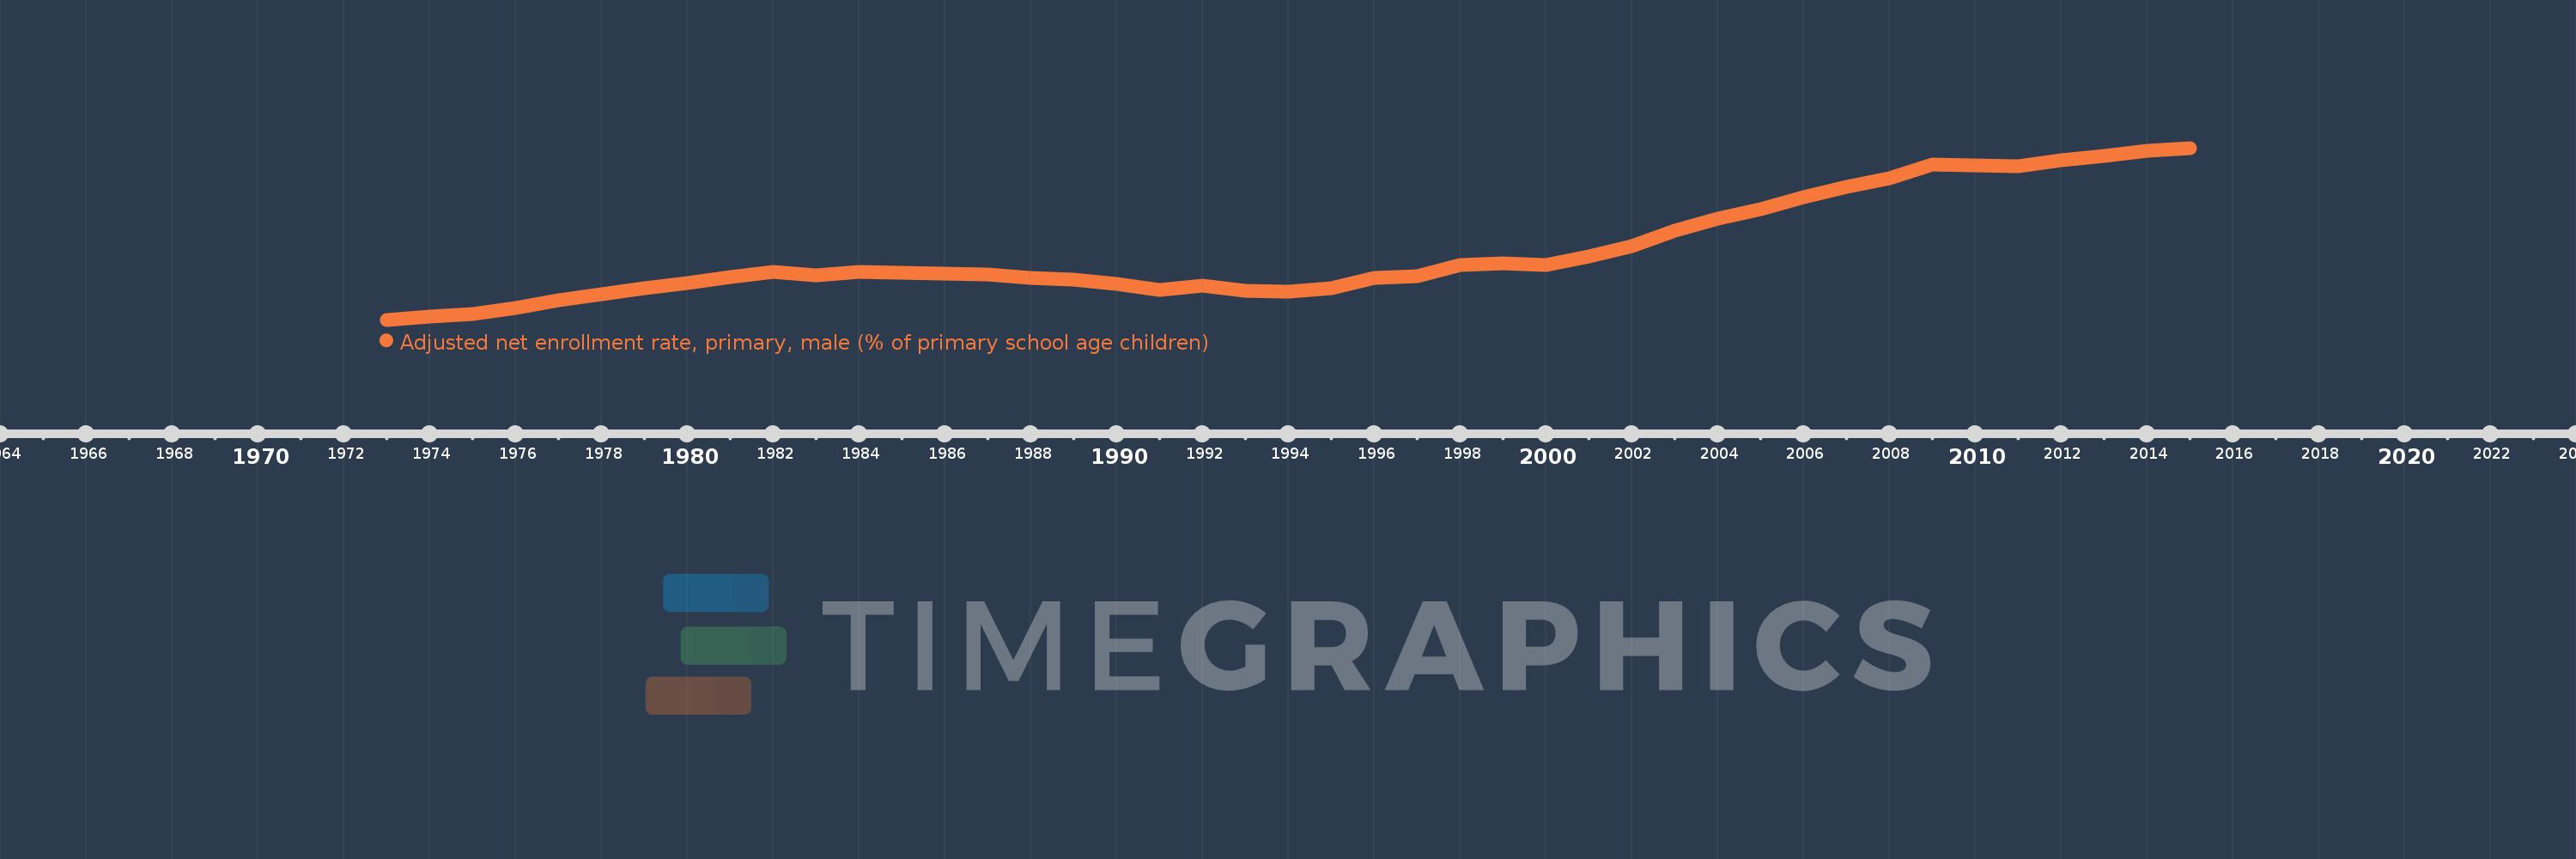
Adjusted net enrollment rate, primary, male (% of primary school age children)
2015,2014,2013,2012,2011,2010,2009,2008,2007,2006,2005,2004,2003,2002,2001,2000,1999,1998,1997,1996,1995,1994,1993,1992,1991,1990,1989,1988,1987,1986,1985,1984,1983,1982,1981,1980,1979,1978,1977,1976,1975,1974,1973
This statistics in other country:
AfghanistanAlbaniaAlgeriaAngolaAntigua and BarbudaArab WorldArgentinaArmeniaArubaAustraliaAustriaAzerbaijanBahamas, TheBahrainBangladeshBarbadosBelarusBelgiumBelizeBeninBermudaBhutanBoliviaBosnia and HerzegovinaBotswanaBrazilBrunei DarussalamBulgariaBurkina FasoBurundiCabo VerdeCambodiaCameroonCanadaCaribbean small statesCentral African RepublicCentral Europe and the BalticsChadChileChinaColombiaComorosCongo, Dem. Rep.Congo, Rep.Costa RicaCote d'IvoireCroatiaCubaCyprusDenmarkDjiboutiDominicaDominican RepublicEarly-demographic dividendEast Asia & PacificEast Asia & Pacific (excluding high income)East Asia & Pacific (IDA & IBRD countries)EcuadorEgypt, Arab Rep.El SalvadorEquatorial GuineaEritreaEstoniaEthiopiaEuro areaEurope & Central AsiaEurope & Central Asia (excluding high income)Europe & Central Asia (IDA & IBRD countries)European UnionFijiFinlandFragile and conflict affected situationsFranceGabonGambia, TheGeorgiaGhanaGreeceGrenadaGuatemalaGuineaGuinea-BissauGuyanaHaitiHeavily indebted poor countries (HIPC)High incomeHondurasHong Kong SAR, ChinaHungaryIBRD onlyIcelandIDA & IBRD totalIDA blendIDA onlyIDA totalIndiaIndonesiaIran, Islamic Rep.IraqIrelandIsraelItalyJamaicaJapanJordanKazakhstanKenyaKiribatiKorea, Dem. People’s Rep.Korea, Rep.KuwaitKyrgyz RepublicLao PDRLate-demographic dividendLatin America & Caribbean Latin America & Caribbean (excluding high income)Latin America & the Caribbean (IDA & IBRD countries)LatviaLeast developed countries: UN classificationLebanonLesothoLiberiaLibyaLiechtensteinLithuaniaLow & middle incomeLow incomeLower middle incomeLuxembourgMacao SAR, ChinaMacedonia, FYRMadagascarMalawiMaldivesMaliMaltaMarshall IslandsMauritaniaMauritiusMexicoMicronesia, Fed. Sts.Middle East & North AfricaMiddle East & North Africa (excluding high income)Middle East & North Africa (IDA & IBRD countries)Middle incomeMoldovaMongoliaMontenegroMoroccoMozambiqueMyanmarNamibiaNauruNepalNetherlandsNew ZealandNicaraguaNigerNigeriaNorth AmericaNorwayOECD membersOmanOther small statesPacific island small statesPakistanPanamaPapua New GuineaParaguayPeruPhilippinesPolandPortugalPost-demographic dividendPre-demographic dividendPuerto RicoQatarRomaniaRussian FederationRwandaSamoaSan MarinoSao Tome and PrincipeSaudi ArabiaSenegalSerbiaSeychellesSierra LeoneSloveniaSmall statesSolomon IslandsSomaliaSouth AfricaSouth AsiaSouth Asia (IDA & IBRD)South SudanSpainSri LankaSt. Kitts and NevisSt. LuciaSt. Vincent and the GrenadinesSub-Saharan Africa Sub-Saharan Africa (excluding high income)Sub-Saharan Africa (IDA & IBRD countries)SudanSurinameSwazilandSwedenSwitzerlandSyrian Arab RepublicTajikistanTanzaniaThailandTimor-LesteTogoTongaTrinidad and TobagoTunisiaTurkeyTuvaluUgandaUkraineUnited Arab EmiratesUnited KingdomUnited StatesUpper middle incomeUruguayUzbekistanVanuatuVenezuela, RBWest Bank and GazaWorldYemen, Rep.ZambiaZimbabwe Timeline:
This timeline shows a graph from 1973 to 2015 of Heavily indebted poor countries (HIPC). No data until 1972. Number of actual observations by date: 43.
Source name:
World Development Indicators
Source organization:
United Nations Educational, Scientific, and Cultural Organization (UNESCO) Institute for Statistics.
Categories, topics:
Education, Gender
Last updated:
apr 23, 2017
Indicators value changes by year
Maximum:
82.766
jan 1, 2015
At the date of observation
Value
Absolute change
Change from previous value
jan 1, 1973
44.58
+44.58
0.0%
jan 1, 1974
45.279
+0.699
1.57%
jan 1, 1975
45.778
+0.499
1.1%
jan 1, 1976
47.218
+1.44
3.15%
jan 1, 1977
48.921
+1.703
3.61%
jan 1, 1978
50.33
+1.409
2.88%
jan 1, 1979
51.616
+1.286
2.56%
jan 1, 1980
52.646
+1.03
2.0%
jan 1, 1981
54.115
+1.469
2.79%
jan 1, 1982
55.135
+1.02
1.88%
jan 1, 1983
54.537
-0.597
-1.08%
jan 1, 1984
55.269
+0.731
1.34%
jan 1, 1985
55.023
-0.246
-0.44%
jan 1, 1986
54.813
-0.21
-0.38%
jan 1, 1987
54.572
-0.241
-0.44%
jan 1, 1988
53.89
-0.682
-1.25%
jan 1, 1989
53.58
-0.31
-0.57%
jan 1, 1990
52.453
-1.127
-2.1%
jan 1, 1991
51.26
-1.192
-2.27%
jan 1, 1992
52.159
+0.898
1.75%
jan 1, 1993
51.042
-1.117
-2.14%
jan 1, 1994
50.74
-0.301
-0.59%
jan 1, 1995
51.649
+0.908
1.79%
jan 1, 1996
53.927
+2.279
4.41%
jan 1, 1997
54.165
+0.237
0.44%
jan 1, 1998
56.783
+2.618
4.83%
jan 1, 1999
57.214
+0.431
0.76%
jan 1, 2000
56.666
-0.548
-0.96%
jan 1, 2001
58.603
+1.937
3.42%
jan 1, 2002
61.028
+2.425
4.14%
jan 1, 2003
64.318
+3.291
5.39%
jan 1, 2004
66.996
+2.677
4.16%
jan 1, 2005
69.187
+2.191
3.27%
jan 1, 2006
71.912
+2.725
3.94%
jan 1, 2007
74.051
+2.139
2.97%
jan 1, 2008
75.993
+1.942
2.62%
jan 1, 2009
79.038
+3.046
4.01%
jan 1, 2010
78.968
-0.071
-0.09%
jan 1, 2011
78.759
-0.208
-0.26%
jan 1, 2012
80.106
+1.346
1.71%
jan 1, 2013
80.946
+0.84
1.05%
jan 1, 2014
82.081
+1.135
1.4%
jan 1, 2015
82.766
+0.685
0.83%
Ranking of countries by current statistics by years


Comments: