29
/
en
AIzaSyAYiBZKx7MnpbEhh9jyipgxe19OcubqV5w
April 1, 2024
34471
Fragile and conflict affected situations
FCS
false
2
1
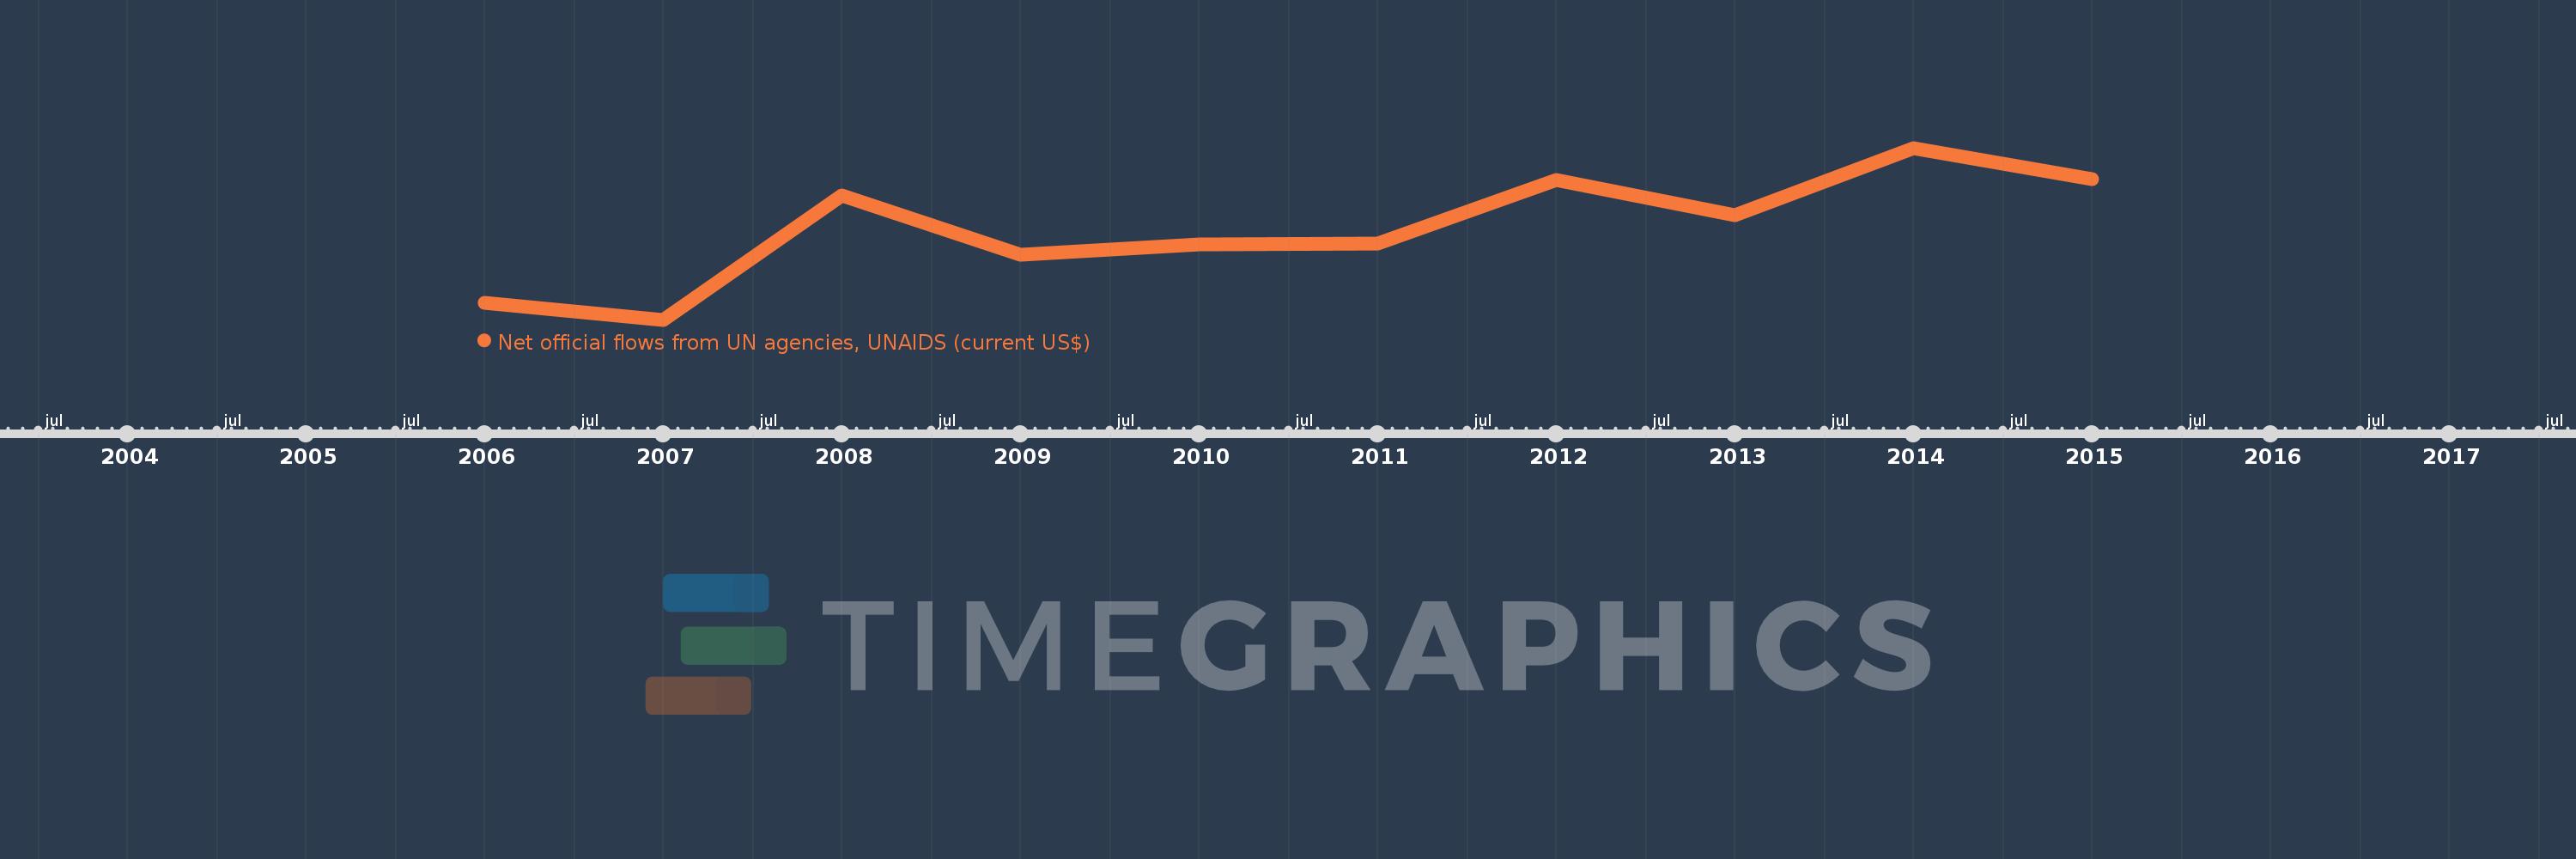
Net official flows from UN agencies, UNAIDS (current US$)
2015,2014,2013,2012,2011,2010,2009,2008,2007,2006
This statistics in other country:
Timeline:
This timeline shows a graph from 2006 to 2015 of Fragile and conflict affected situations. No data until 2005. Number of actual observations by date: 10.
Source name:
World Development Indicators
Source organization:
Development Assistance Committee of the Organisation for Economic Co-operation and Development, Geographical Distribution of Financial Flows to Developing Countries, Development Co-operation Report, and International Development Statistics database. Data are available online at: www.oecd.org/dac/stats/idsonline.
Categories, topics:
Aid Effectiveness
Last updated:
apr 23, 2017
Indicators value changes by year
Minimum:
5.03 mln
jan 1, 2007
Maximum:
15.27 mln
jan 1, 2014
At the date of observation
Value
Absolute change
Change from previous value
jan 1, 2006
6.03 mln
+6.03 mln
0.0%
jan 1, 2007
5.03 mln
-1000.0K
-16.58%
jan 1, 2008
12.45 mln
+7.42 mln
147.51%
jan 1, 2009
8.93 mln
-3.52 mln
-28.27%
jan 1, 2010
9.54 mln
+610.0K
6.83%
jan 1, 2011
9.56 mln
+20.0K
0.21%
jan 1, 2012
13.37 mln
+3.81 mln
39.85%
jan 1, 2013
11.24 mln
-2.13 mln
-15.93%
jan 1, 2014
15.27 mln
+4.03 mln
35.85%
jan 1, 2015
13.41 mln
-1.86 mln
-12.18%
Ranking of countries by current statistics by years


Comments: