29
/
en
AIzaSyAYiBZKx7MnpbEhh9jyipgxe19OcubqV5w
April 1, 2024
33976
European Union
EUU
false
2
1
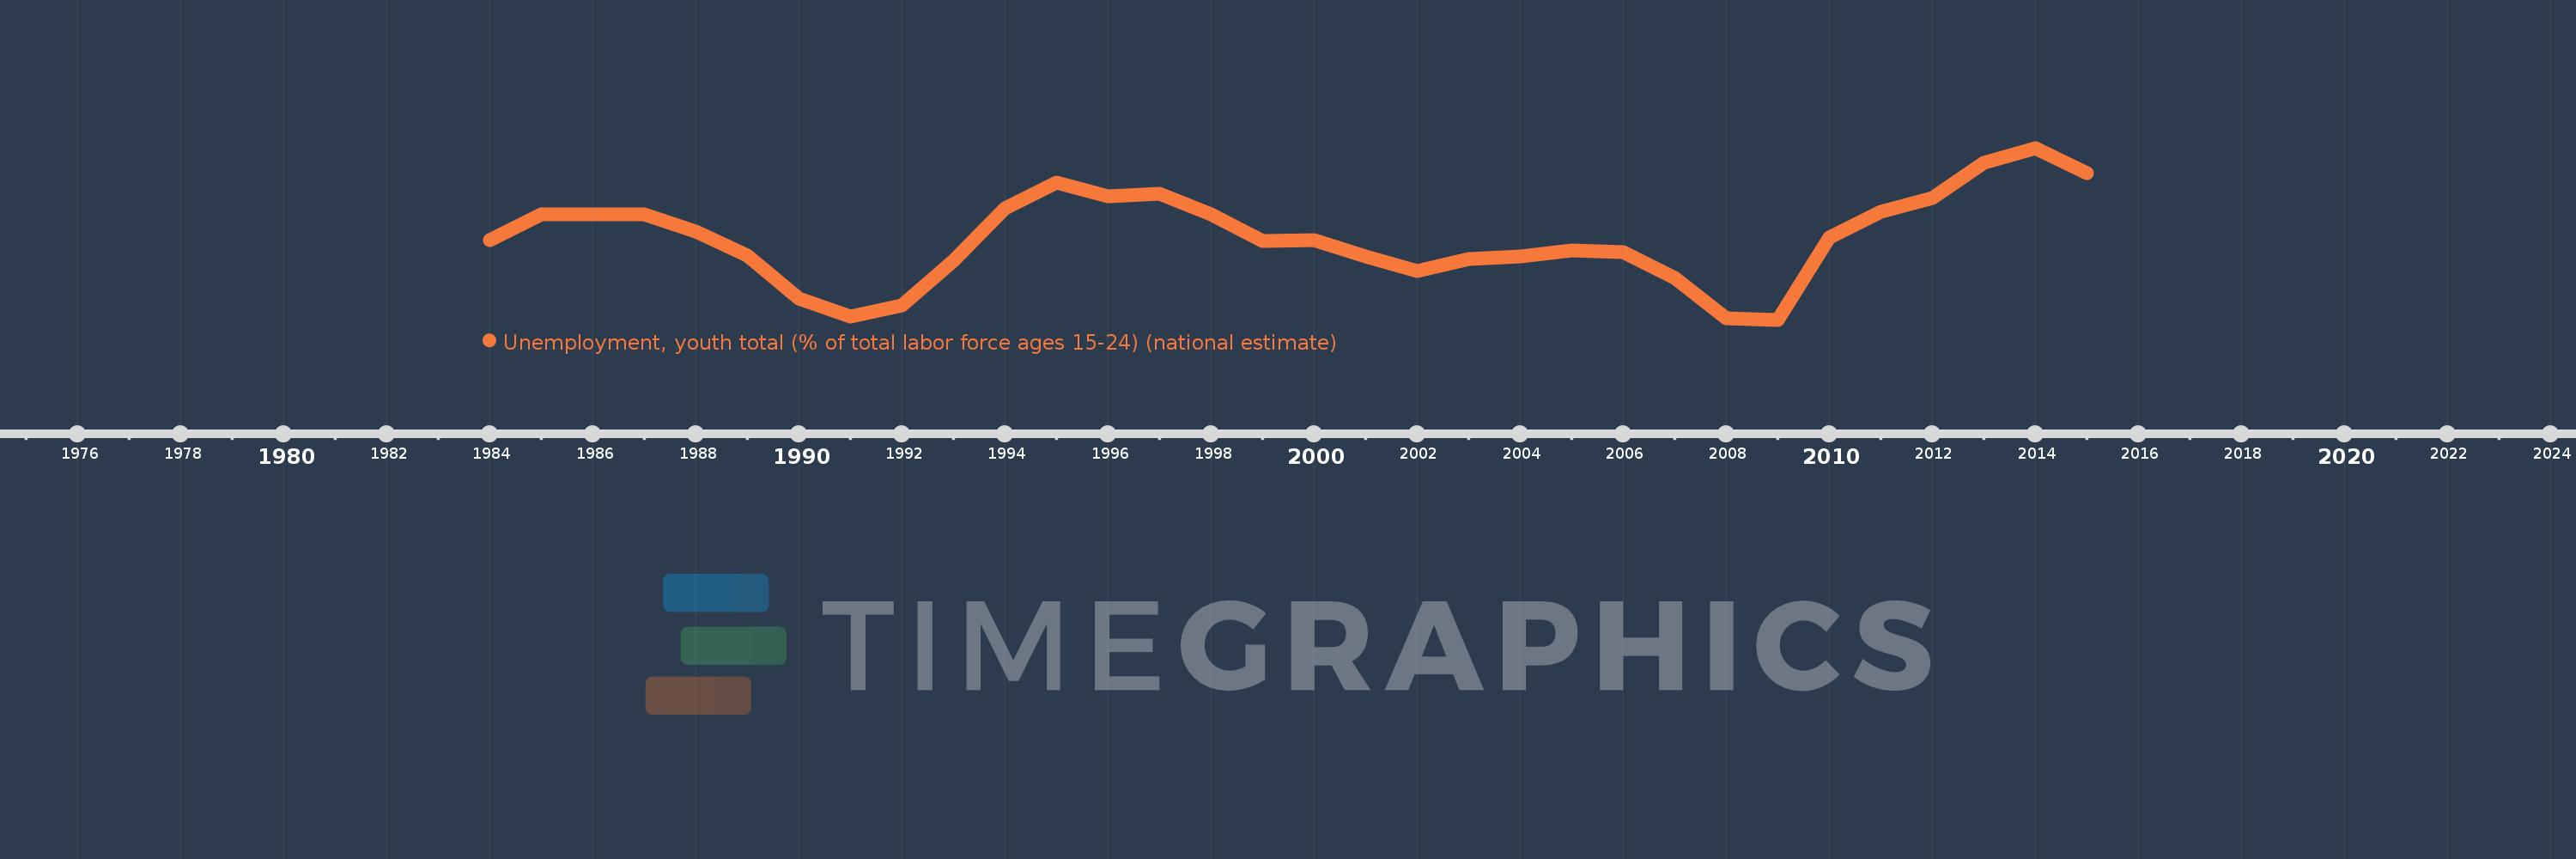
Unemployment, youth total (% of total labor force ages 15-24) (national estimate)
2015,2014,2013,2012,2011,2010,2009,2008,2007,2006,2005,2004,2003,2002,2001,2000,1999,1998,1997,1996,1995,1994,1993,1992,1991,1990,1989,1988,1987,1986,1985,1984
This statistics in other country:
AlbaniaAlgeriaAmerican SamoaAntigua and BarbudaArab WorldArgentinaArmeniaArubaAustraliaAustriaAzerbaijanBahamas, TheBahrainBangladeshBarbadosBelarusBelgiumBelizeBeninBermudaBhutanBoliviaBosnia and HerzegovinaBotswanaBrazilBritish Virgin IslandsBulgariaBurkina FasoBurundiCabo VerdeCambodiaCameroonCanadaCaribbean small statesCayman IslandsCentral Europe and the BalticsChileColombiaCosta RicaCroatiaCubaCyprusCzech RepublicDenmarkDominicaDominican RepublicEarly-demographic dividendEcuadorEgypt, Arab Rep.El SalvadorEstoniaEthiopiaEuro areaEurope & Central AsiaEurope & Central Asia (excluding high income)Europe & Central Asia (IDA & IBRD countries)European UnionFaroe IslandsFijiFinlandFranceFrench PolynesiaGabonGambia, TheGeorgiaGermanyGhanaGreeceGrenadaGuamGuatemalaGuineaGuyanaHaitiHigh incomeHondurasHong Kong SAR, ChinaHungaryIcelandIDA blendIndiaIndonesiaIran, Islamic Rep.IrelandIsle of ManIsraelItalyJamaicaJapanJordanKazakhstanKiribatiKorea, Rep.KosovoKuwaitKyrgyz RepublicLao PDRLatin America & Caribbean Latin America & Caribbean (excluding high income)Latin America & the Caribbean (IDA & IBRD countries)LatviaLebanonLesothoLiberiaLibyaLithuaniaLower middle incomeLuxembourgMacao SAR, ChinaMacedonia, FYRMadagascarMalawiMalaysiaMaldivesMaliMaltaMarshall IslandsMauritiusMexicoMiddle East & North AfricaMiddle East & North Africa (excluding high income)Middle East & North Africa (IDA & IBRD countries)MoldovaMonacoMongoliaMontenegroMoroccoMozambiqueNamibiaNauruNepalNetherlandsNew ZealandNicaraguaNigerNigeriaNorth AmericaNorthern Mariana IslandsNorwayOECD membersPakistanPalauPanamaPapua New GuineaParaguayPeruPhilippinesPolandPortugalPost-demographic dividendPuerto RicoQatarRomaniaRussian FederationRwandaSamoaSan MarinoSao Tome and PrincipeSaudi ArabiaSenegalSerbiaSeychellesSierra LeoneSingaporeSlovak RepublicSloveniaSolomon IslandsSouth AfricaSouth AsiaSouth Asia (IDA & IBRD)South SudanSpainSri LankaSt. Kitts and NevisSt. LuciaSt. Vincent and the GrenadinesSudanSurinameSwazilandSwedenSwitzerlandSyrian Arab RepublicTajikistanTanzaniaThailandTimor-LesteTongaTrinidad and TobagoTunisiaTurkeyUgandaUkraineUnited Arab EmiratesUnited KingdomUnited StatesUruguayVanuatuVenezuela, RBVietnamWest Bank and GazaYemen, Rep.ZambiaZimbabwe Timeline:
This timeline shows a graph from 1984 to 2015 of European Union. No data until 1983. Number of actual observations by date: 32.
Source name:
World Development Indicators
Source organization:
International Labour Organization, Key Indicators of the Labour Market database.
Categories, topics:
Social Protection & Labor
Last updated:
apr 23, 2017
Indicators value changes by year
Maximum:
25.722
jan 1, 2014
At the date of observation
Value
Absolute change
Change from previous value
jan 1, 1984
20.695
+20.695
0.0%
jan 1, 1985
22.093
+1.399
6.76%
jan 1, 1986
22.102
+0.009
0.04%
jan 1, 1987
22.111
+0.009
0.04%
jan 1, 1988
21.173
-0.938
-4.24%
jan 1, 1989
19.853
-1.32
-6.23%
jan 1, 1990
17.534
-2.319
-11.68%
jan 1, 1991
16.55
-0.984
-5.61%
jan 1, 1992
17.158
+0.608
3.67%
jan 1, 1993
19.618
+2.46
14.34%
jan 1, 1994
22.421
+2.803
14.29%
jan 1, 1995
23.858
+1.437
6.41%
jan 1, 1996
23.074
-0.784
-3.29%
jan 1, 1997
23.24
+0.166
0.72%
jan 1, 1998
22.129
-1.111
-4.78%
jan 1, 1999
20.648
-1.481
-6.69%
jan 1, 2000
20.732
+0.085
0.41%
jan 1, 2001
19.819
-0.913
-4.4%
jan 1, 2002
19.039
-0.78
-3.93%
jan 1, 2003
19.67
+0.631
3.31%
jan 1, 2004
19.837
+0.166
0.85%
jan 1, 2005
20.157
+0.321
1.62%
jan 1, 2006
20.067
-0.091
-0.45%
jan 1, 2007
18.652
-1.415
-7.05%
jan 1, 2008
16.485
-2.167
-11.62%
jan 1, 2009
16.39
-0.095
-0.57%
jan 1, 2010
20.839
+4.449
27.15%
jan 1, 2011
22.24
+1.401
6.72%
jan 1, 2012
23.016
+0.775
3.49%
jan 1, 2013
24.932
+1.916
8.32%
jan 1, 2014
25.722
+0.79
3.17%
jan 1, 2015
24.34
-1.382
-5.37%
Ranking of countries by current statistics by years


Comments: