29
/
en
AIzaSyAYiBZKx7MnpbEhh9jyipgxe19OcubqV5w
April 1, 2024
33748
European Union
EUU
false
2
1
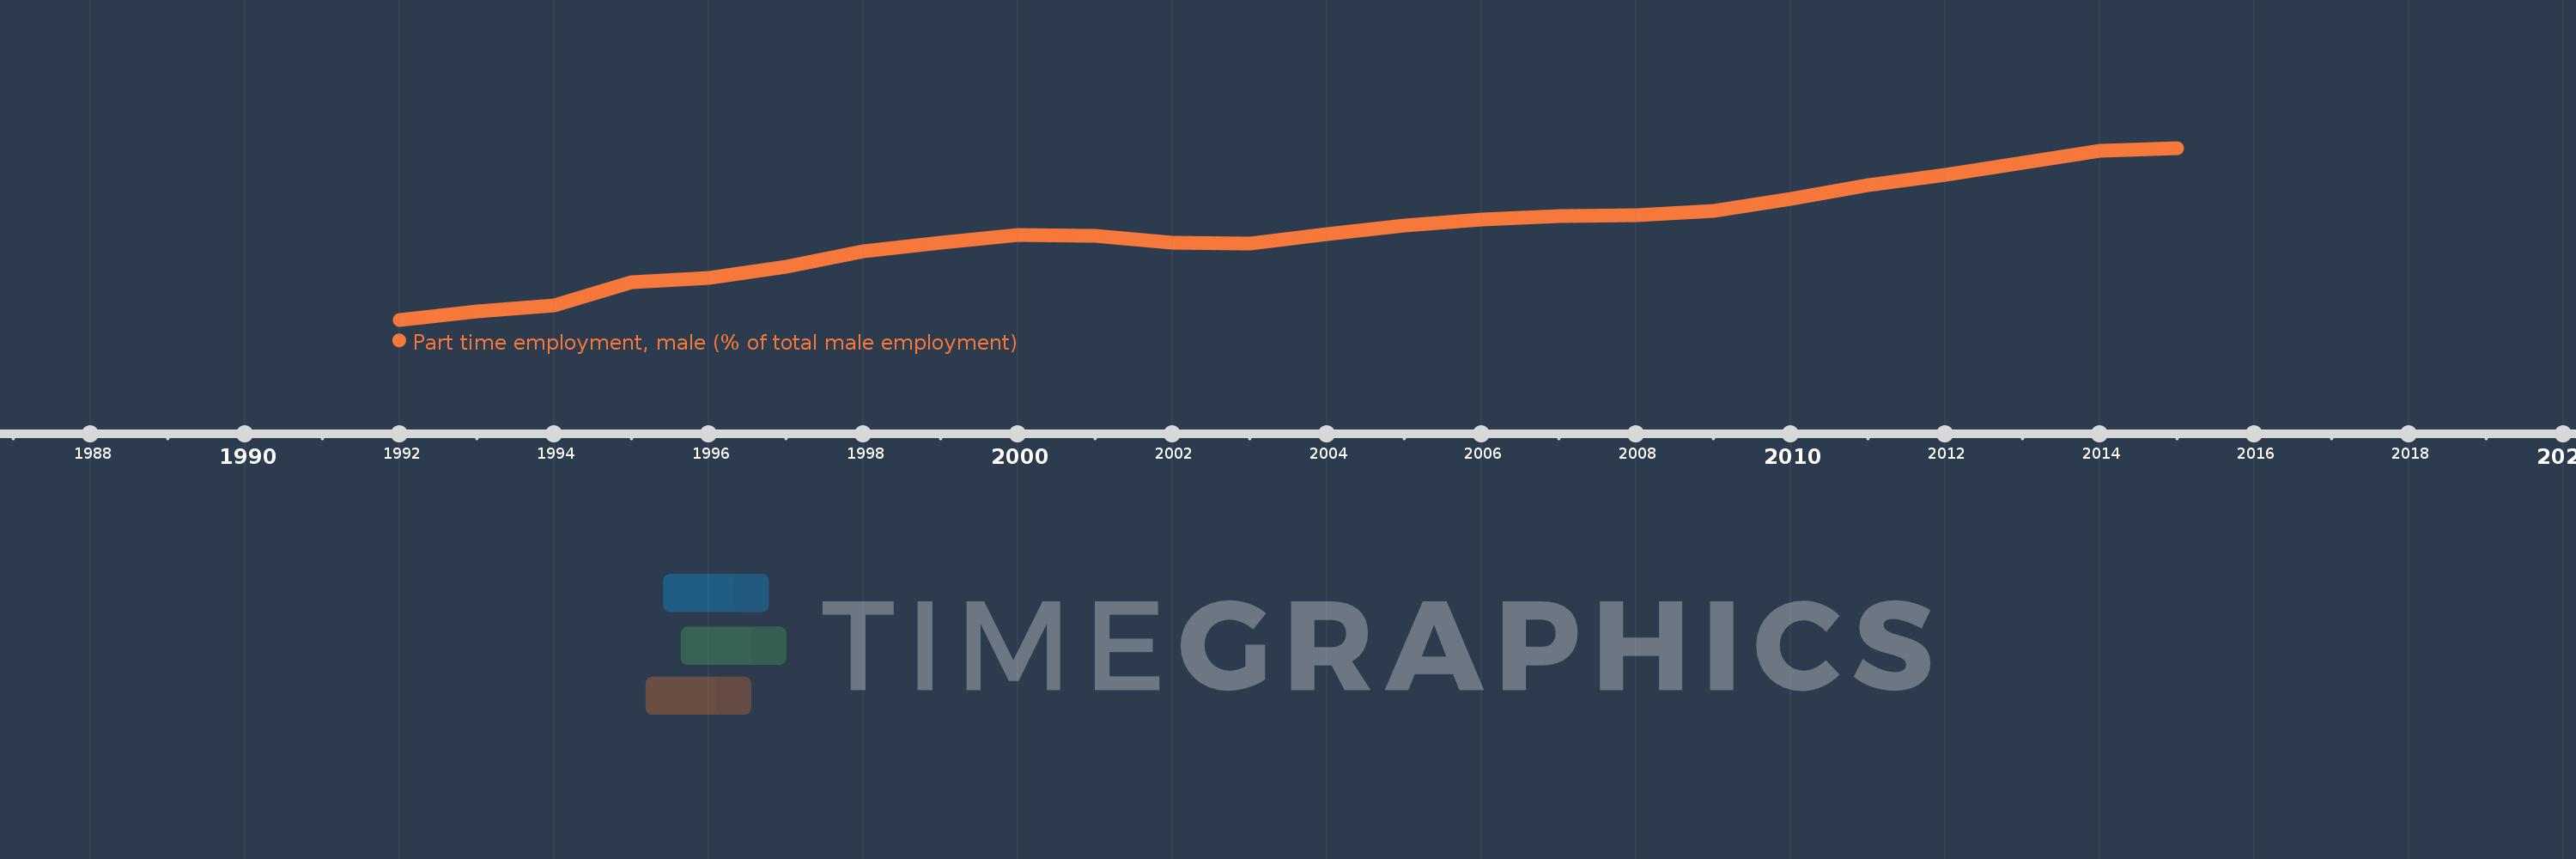
Part time employment, male (% of total male employment)
2015,2014,2013,2012,2011,2010,2009,2008,2007,2006,2005,2004,2003,2002,2001,2000,1999,1998,1997,1996,1995,1994,1993,1992
This statistics in other country:
Timeline:
This timeline shows a graph from 1992 to 2015 of European Union. No data until 1991. Number of actual observations by date: 24.
Source name:
World Development Indicators
Source organization:
International Labour Organization, Key Indicators of the Labour Market database.
Categories, topics:
Social Protection & Labor, Gender
Last updated:
apr 23, 2017
Indicators value changes by year
At the date of observation
Value
Absolute change
Change from previous value
jan 1, 1992
3.903
+3.903
0.0%
jan 1, 1993
4.142
+0.24
6.14%
jan 1, 1994
4.31
+0.168
4.05%
jan 1, 1995
4.988
+0.677
15.71%
jan 1, 1996
5.117
+0.13
2.6%
jan 1, 1997
5.436
+0.319
6.24%
jan 1, 1998
5.879
+0.443
8.14%
jan 1, 1999
6.124
+0.245
4.16%
jan 1, 2000
6.355
+0.231
3.77%
jan 1, 2001
6.321
-0.034
-0.54%
jan 1, 2002
6.12
-0.201
-3.18%
jan 1, 2003
6.1
-0.02
-0.32%
jan 1, 2004
6.357
+0.257
4.22%
jan 1, 2005
6.608
+0.251
3.94%
jan 1, 2006
6.779
+0.172
2.6%
jan 1, 2007
6.889
+0.11
1.62%
jan 1, 2008
6.901
+0.012
0.18%
jan 1, 2009
7.045
+0.144
2.09%
jan 1, 2010
7.377
+0.332
4.72%
jan 1, 2011
7.773
+0.395
5.36%
jan 1, 2012
8.067
+0.294
3.79%
jan 1, 2013
8.421
+0.354
4.39%
jan 1, 2014
8.774
+0.354
4.2%
jan 1, 2015
8.85
+0.076
0.86%
Ranking of countries by current statistics by years


Comments: