29
/
en
AIzaSyAYiBZKx7MnpbEhh9jyipgxe19OcubqV5w
April 1, 2024
33605
European Union
EUU
false
2
1
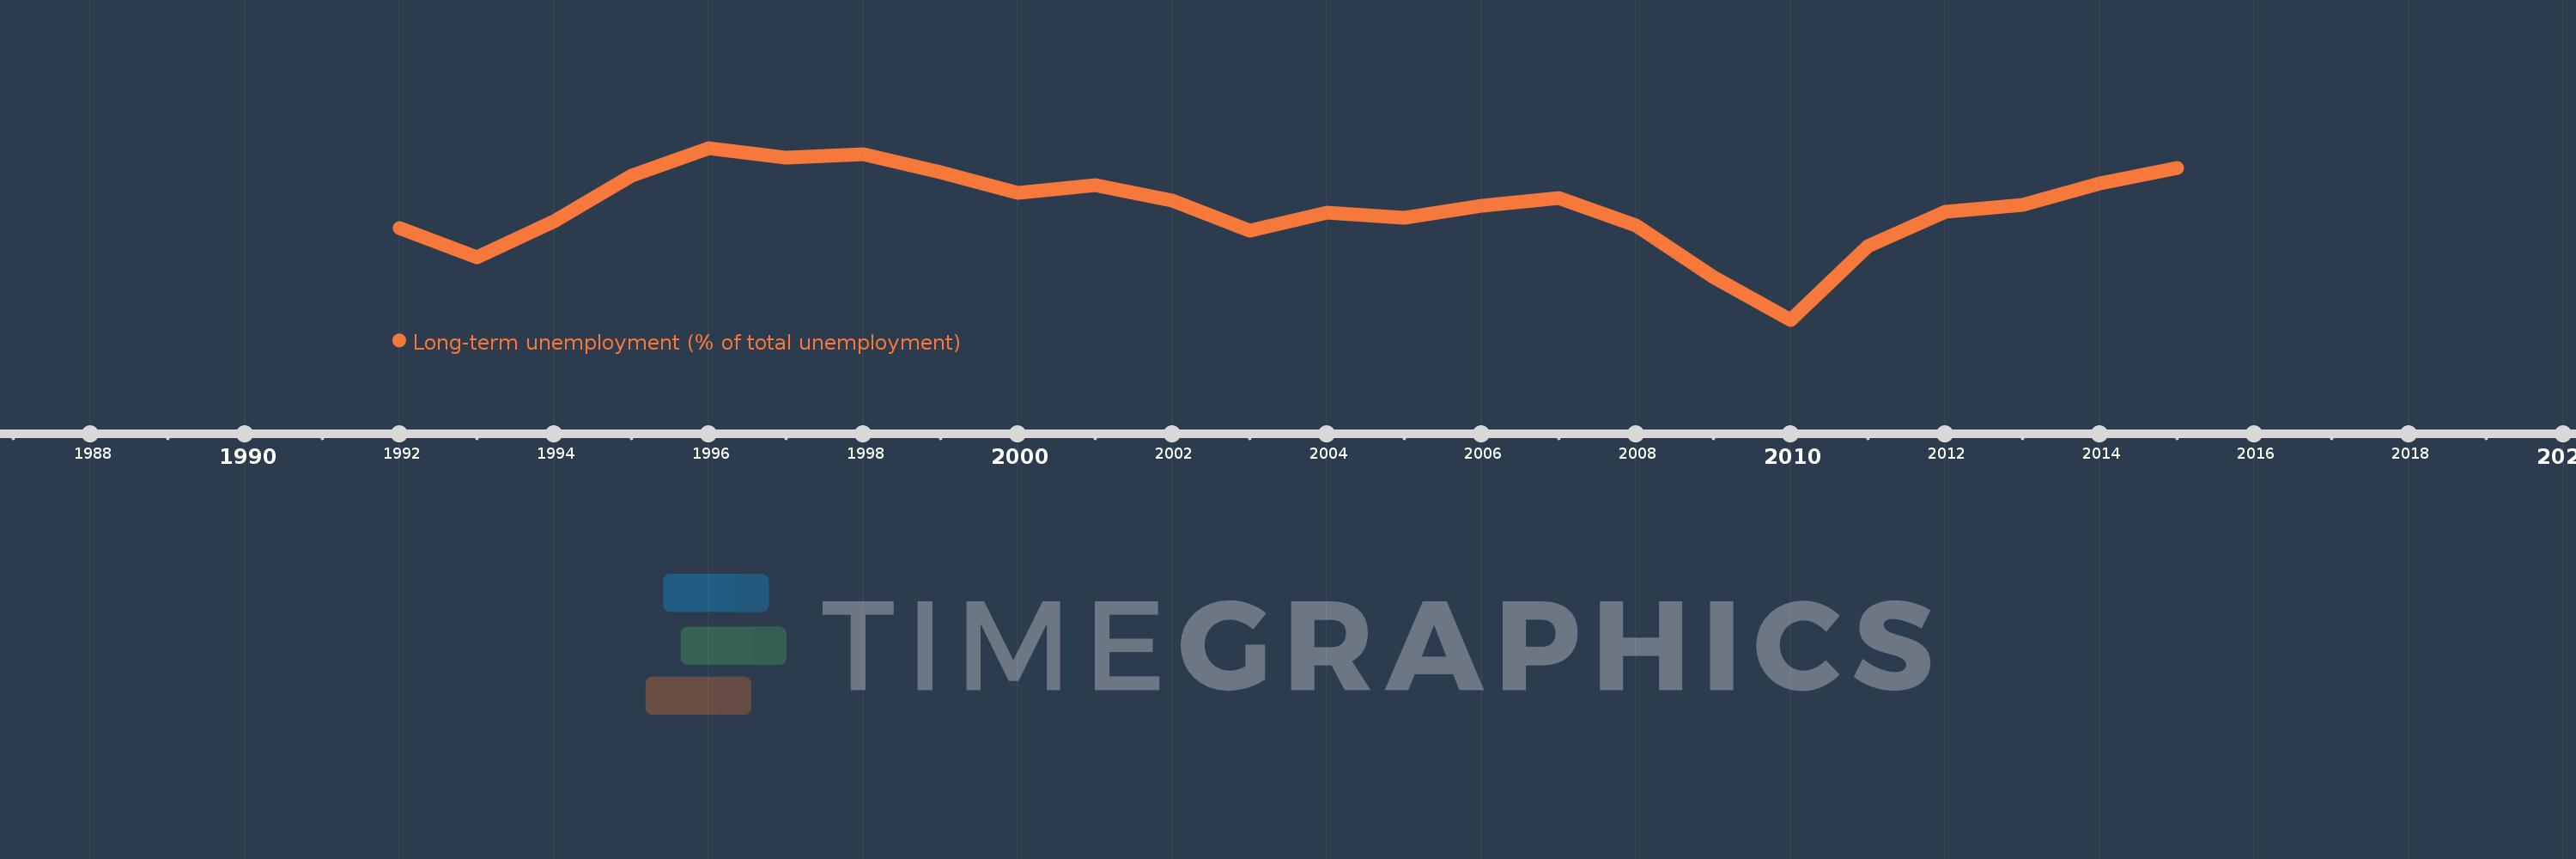
Long-term unemployment (% of total unemployment)
2015,2014,2013,2012,2011,2010,2009,2008,2007,2006,2005,2004,2003,2002,2001,2000,1999,1998,1997,1996,1995,1994,1993,1992
This statistics in other country:
Timeline:
This timeline shows a graph from 1992 to 2015 of European Union. No data until 1991. Number of actual observations by date: 24.
Source name:
World Development Indicators
Source organization:
International Labour Organization, Key Indicators of the Labour Market database.
Categories, topics:
Social Protection & Labor
Last updated:
apr 23, 2017
Indicators value changes by year
Minimum:
33.457
jan 1, 2010
Maximum:
46.447
jan 1, 1996
At the date of observation
Value
Absolute change
Change from previous value
jan 1, 1992
40.368
+40.368
0.0%
jan 1, 1993
38.202
-2.165
-5.36%
jan 1, 1994
40.935
+2.733
7.15%
jan 1, 1995
44.338
+3.403
8.31%
jan 1, 1996
46.447
+2.109
4.76%
jan 1, 1997
45.744
-0.704
-1.52%
jan 1, 1998
45.957
+0.214
0.47%
jan 1, 1999
44.62
-1.337
-2.91%
jan 1, 2000
43.058
-1.563
-3.5%
jan 1, 2001
43.646
+0.588
1.37%
jan 1, 2002
42.454
-1.192
-2.73%
jan 1, 2003
40.173
-2.281
-5.37%
jan 1, 2004
41.525
+1.352
3.37%
jan 1, 2005
41.184
-0.341
-0.82%
jan 1, 2006
42.105
+0.921
2.24%
jan 1, 2007
42.638
+0.533
1.27%
jan 1, 2008
40.566
-2.072
-4.86%
jan 1, 2009
36.656
-3.909
-9.64%
jan 1, 2010
33.457
-3.199
-8.73%
jan 1, 2011
39.038
+5.581
16.68%
jan 1, 2012
41.649
+2.611
6.69%
jan 1, 2013
42.132
+0.483
1.16%
jan 1, 2014
43.753
+1.621
3.85%
jan 1, 2015
44.958
+1.206
2.76%
Ranking of countries by current statistics by years


Comments: