29
/
en
AIzaSyAYiBZKx7MnpbEhh9jyipgxe19OcubqV5w
April 1, 2024
33579
European Union
EUU
false
2
1
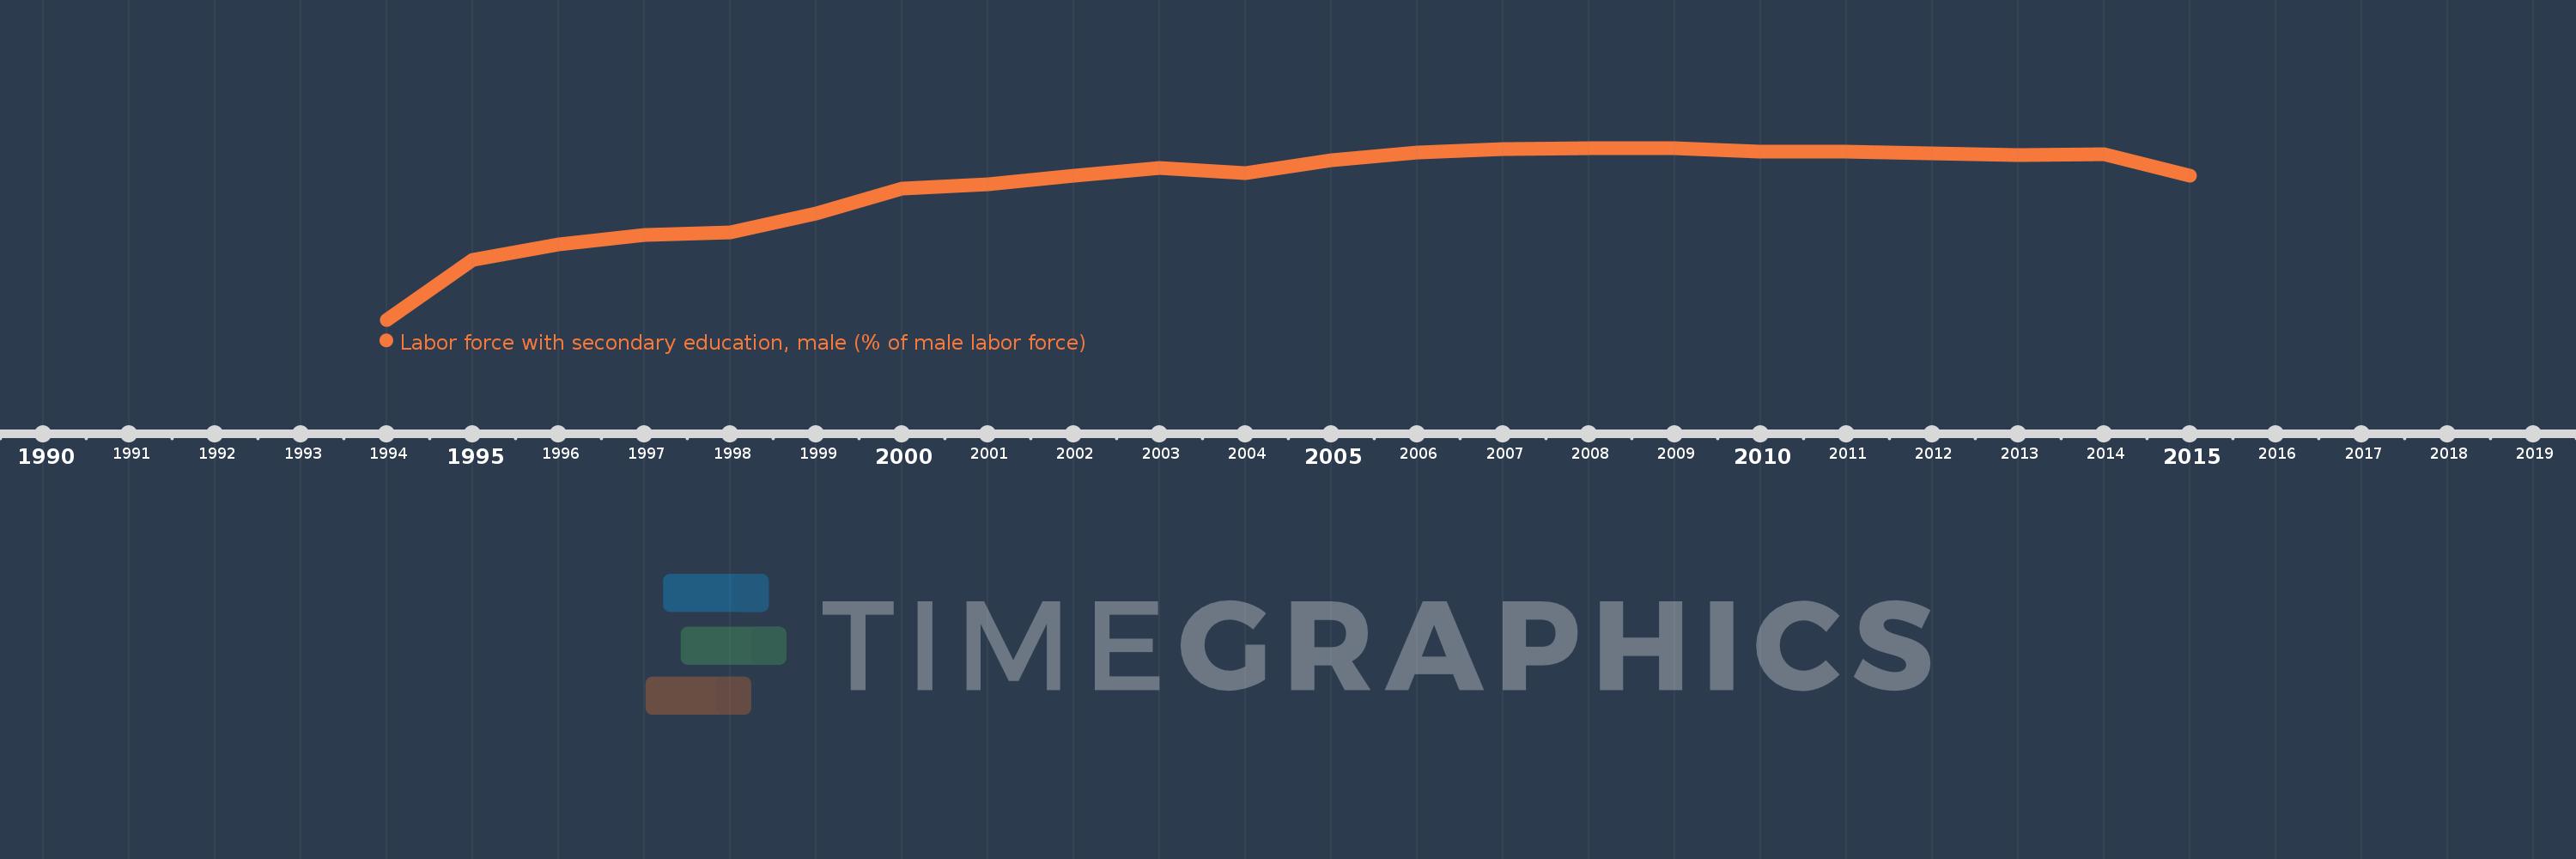
Labor force with secondary education, male (% of male labor force)
2015,2014,2013,2012,2011,2010,2009,2008,2007,2006,2005,2004,2003,2002,2001,2000,1999,1998,1997,1996,1995,1994
This statistics in other country:
Timeline:
This timeline shows a graph from 1994 to 2015 of European Union. No data until 1993. Number of actual observations by date: 22.
Source name:
World Development Indicators
Source organization:
International Labour Organization, Key Indicators of the Labour Market database.
Categories, topics:
Education, Social Protection & Labor, Gender
Last updated:
apr 23, 2017
Indicators value changes by year
Minimum:
37.909
jan 1, 1994
Maximum:
51.399
jan 1, 2008
At the date of observation
Value
Absolute change
Change from previous value
jan 1, 1994
37.909
+37.909
0.0%
jan 1, 1995
42.58
+4.672
12.32%
jan 1, 1996
43.843
+1.262
2.96%
jan 1, 1997
44.577
+0.734
1.68%
jan 1, 1998
44.78
+0.203
0.45%
jan 1, 1999
46.242
+1.463
3.27%
jan 1, 2000
48.177
+1.934
4.18%
jan 1, 2001
48.575
+0.398
0.83%
jan 1, 2002
49.2
+0.625
1.29%
jan 1, 2003
49.827
+0.627
1.27%
jan 1, 2004
49.416
-0.411
-0.83%
jan 1, 2005
50.419
+1.003
2.03%
jan 1, 2006
51.016
+0.598
1.19%
jan 1, 2007
51.336
+0.319
0.63%
jan 1, 2008
51.399
+0.064
0.12%
jan 1, 2009
51.369
-0.03
-0.06%
jan 1, 2010
51.133
-0.236
-0.46%
jan 1, 2011
51.097
-0.036
-0.07%
jan 1, 2012
50.997
-0.1
-0.2%
jan 1, 2013
50.852
-0.145
-0.28%
jan 1, 2014
50.913
+0.061
0.12%
jan 1, 2015
49.193
-1.72
-3.38%
Ranking of countries by current statistics by years


Comments: