29
/
en
AIzaSyAYiBZKx7MnpbEhh9jyipgxe19OcubqV5w
April 1, 2024
33437
European Union
EUU
false
2
1
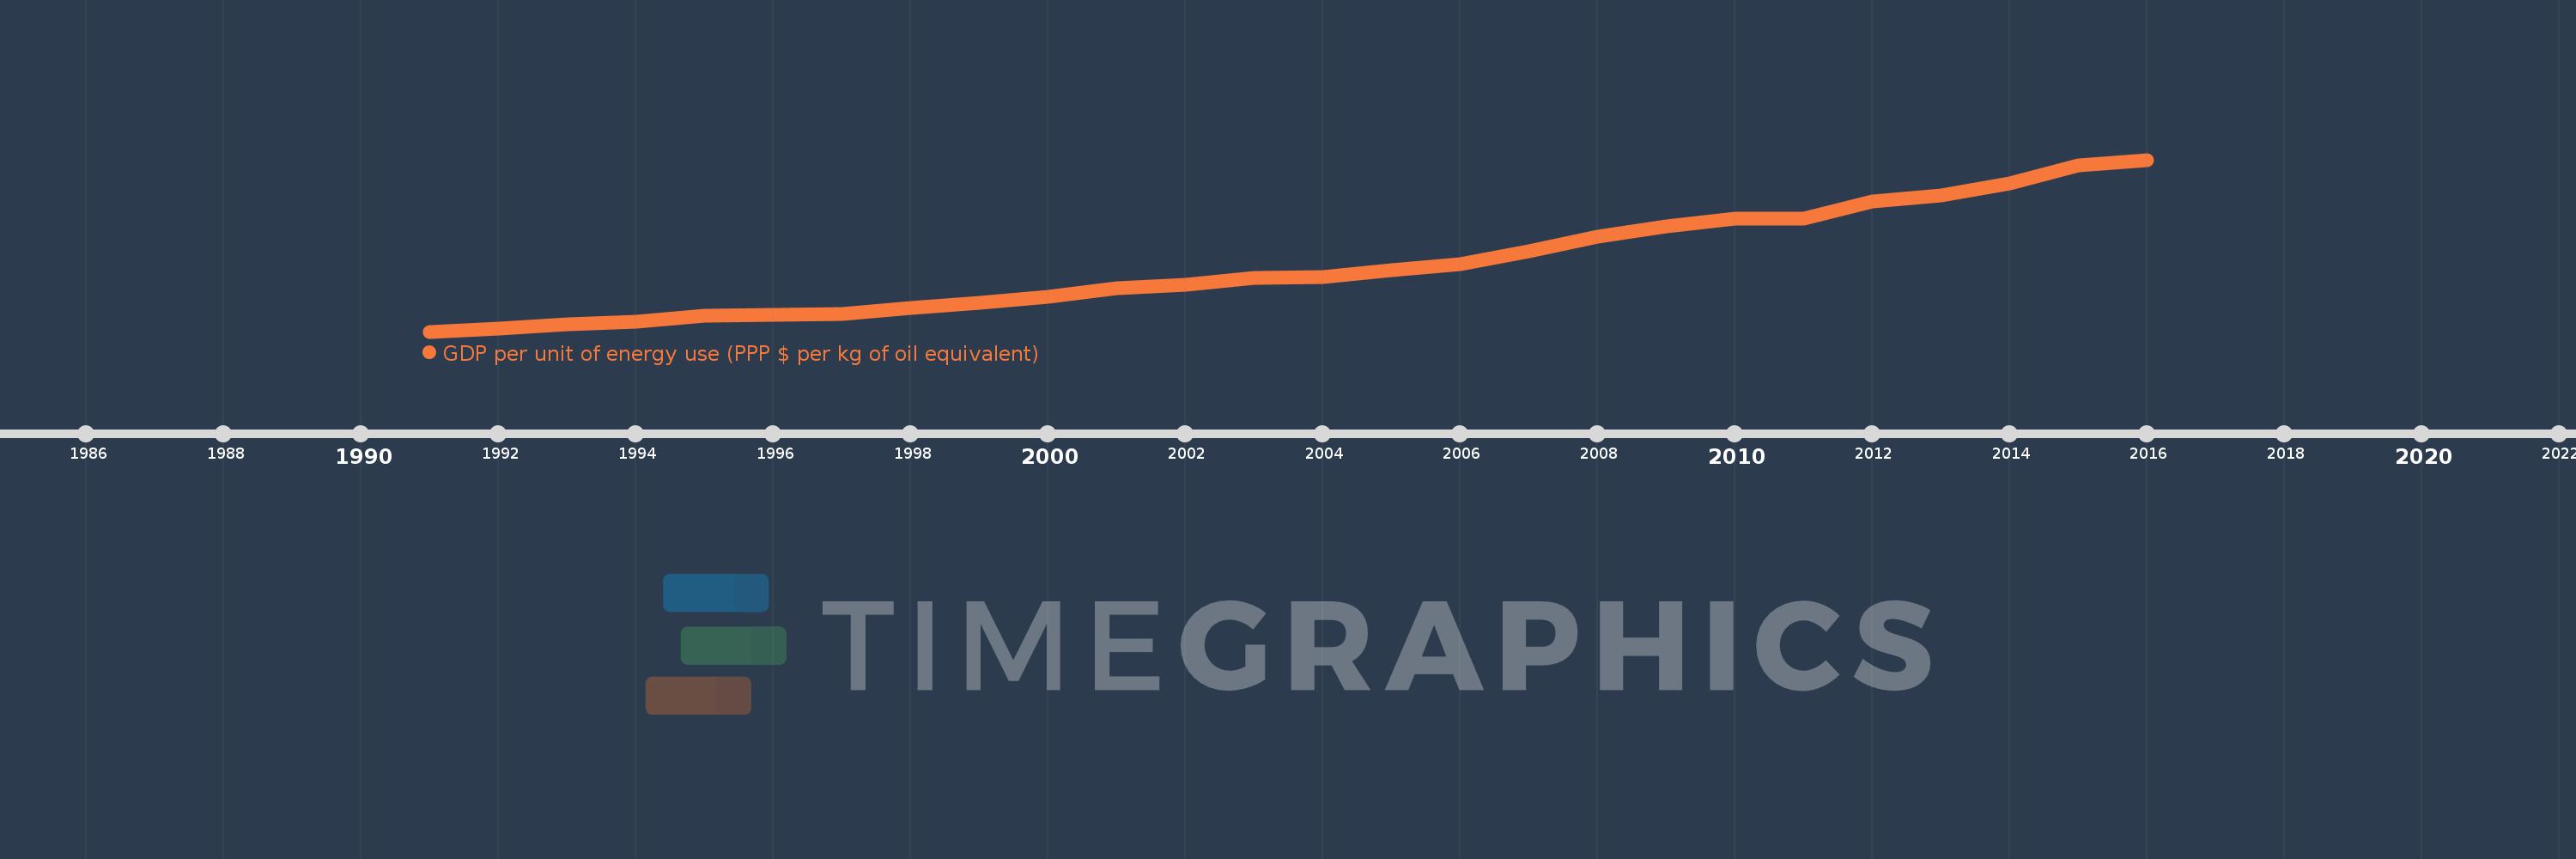
GDP per unit of energy use (PPP $ per kg of oil equivalent)
2016,2015,2014,2013,2012,2011,2010,2009,2008,2007,2006,2005,2004,2003,2002,2001,2000,1999,1998,1997,1996,1995,1994,1993,1992,1991
This statistics in other country:
AlbaniaAlgeriaAngolaAntigua and BarbudaArab WorldArgentinaArmeniaAustraliaAustriaAzerbaijanBahamas, TheBahrainBangladeshBarbadosBelarusBelgiumBelizeBeninBhutanBoliviaBosnia and HerzegovinaBotswanaBrazilBrunei DarussalamBulgariaCabo VerdeCambodiaCameroonCanadaCaribbean small statesCentral Europe and the BalticsChileChinaColombiaComorosCongo, Dem. Rep.Congo, Rep.Costa RicaCote d'IvoireCroatiaCubaCyprusCzech RepublicDenmarkDjiboutiDominicaDominican RepublicEarly-demographic dividendEast Asia & PacificEast Asia & Pacific (excluding high income)East Asia & Pacific (IDA & IBRD countries)EcuadorEgypt, Arab Rep.El SalvadorEquatorial GuineaEritreaEstoniaEthiopiaEuro areaEurope & Central AsiaEurope & Central Asia (excluding high income)Europe & Central Asia (IDA & IBRD countries)European UnionFijiFinlandFranceGabonGambia, TheGeorgiaGermanyGhanaGreeceGrenadaGuatemalaGuinea-BissauGuyanaHaitiHeavily indebted poor countries (HIPC)High incomeHondurasHong Kong SAR, ChinaHungaryIBRD onlyIcelandIDA & IBRD totalIDA blendIDA onlyIDA totalIndiaIndonesiaIran, Islamic Rep.IraqIrelandIsraelItalyJamaicaJapanJordanKazakhstanKenyaKiribatiKorea, Rep.KosovoKuwaitKyrgyz RepublicLate-demographic dividendLatin America & Caribbean Latin America & Caribbean (excluding high income)Latin America & the Caribbean (IDA & IBRD countries)LatviaLeast developed countries: UN classificationLebanonLesothoLibyaLithuaniaLow & middle incomeLower middle incomeLuxembourgMacedonia, FYRMalaysiaMaldivesMaltaMarshall IslandsMauritiusMexicoMiddle East & North AfricaMiddle East & North Africa (excluding high income)Middle East & North Africa (IDA & IBRD countries)Middle incomeMoldovaMongoliaMontenegroMoroccoMozambiqueMyanmarNamibiaNepalNetherlandsNew ZealandNicaraguaNigerNigeriaNorth AmericaNorwayOECD membersOmanOther small statesPacific island small statesPakistanPanamaParaguayPeruPhilippinesPolandPortugalPost-demographic dividendPre-demographic dividendQatarRomaniaRussian FederationSamoaSao Tome and PrincipeSaudi ArabiaSenegalSerbiaSeychellesSingaporeSlovak RepublicSloveniaSmall statesSolomon IslandsSouth AfricaSouth AsiaSouth Asia (IDA & IBRD)South SudanSpainSri LankaSt. Kitts and NevisSt. LuciaSt. Vincent and the GrenadinesSub-Saharan Africa Sub-Saharan Africa (excluding high income)Sub-Saharan Africa (IDA & IBRD countries)SudanSurinameSwazilandSwedenSwitzerlandTajikistanTanzaniaThailandTimor-LesteTogoTongaTrinidad and TobagoTunisiaTurkeyTurkmenistanUkraineUnited Arab EmiratesUnited KingdomUnited StatesUpper middle incomeUruguayUzbekistanVanuatuVenezuela, RBVietnamWorldYemen, Rep.ZambiaZimbabwe Timeline:
This timeline shows a graph from 1991 to 2016 of European Union. No data until 1990. Number of actual observations by date: 26.
Source name:
World Development Indicators
Source organization:
IEA Statistics © OECD/IEA 2014 (http://www.iea.org/stats/index.asp), subject to https://www.iea.org/t&c/termsandconditions/
Categories, topics:
Energy & Mining
Last updated:
apr 23, 2017
Indicators value changes by year
Maximum:
12.473
jan 1, 2016
At the date of observation
Value
Absolute change
Change from previous value
jan 1, 1991
4.493
+4.493
0.0%
jan 1, 1992
4.645
+0.152
3.38%
jan 1, 1993
4.848
+0.202
4.36%
jan 1, 1994
4.954
+0.107
2.2%
jan 1, 1995
5.222
+0.268
5.4%
jan 1, 1996
5.278
+0.056
1.08%
jan 1, 1997
5.315
+0.037
0.69%
jan 1, 1998
5.608
+0.293
5.52%
jan 1, 1999
5.825
+0.217
3.87%
jan 1, 2000
6.117
+0.292
5.02%
jan 1, 2001
6.494
+0.377
6.16%
jan 1, 2002
6.687
+0.193
2.98%
jan 1, 2003
6.998
+0.311
4.66%
jan 1, 2004
7.044
+0.045
0.65%
jan 1, 2005
7.344
+0.3
4.26%
jan 1, 2006
7.606
+0.263
3.58%
jan 1, 2007
8.23
+0.624
8.2%
jan 1, 2008
8.897
+0.667
8.1%
jan 1, 2009
9.373
+0.476
5.35%
jan 1, 2010
9.745
+0.372
3.96%
jan 1, 2011
9.728
-0.017
-0.17%
jan 1, 2012
10.547
+0.819
8.42%
jan 1, 2013
10.821
+0.274
2.6%
jan 1, 2014
11.365
+0.544
5.03%
jan 1, 2015
12.197
+0.832
7.32%
jan 1, 2016
12.473
+0.277
2.27%
Ranking of countries by current statistics by years


Comments: