29
/
en
AIzaSyAYiBZKx7MnpbEhh9jyipgxe19OcubqV5w
April 1, 2024
33347
European Union
EUU
false
2
1
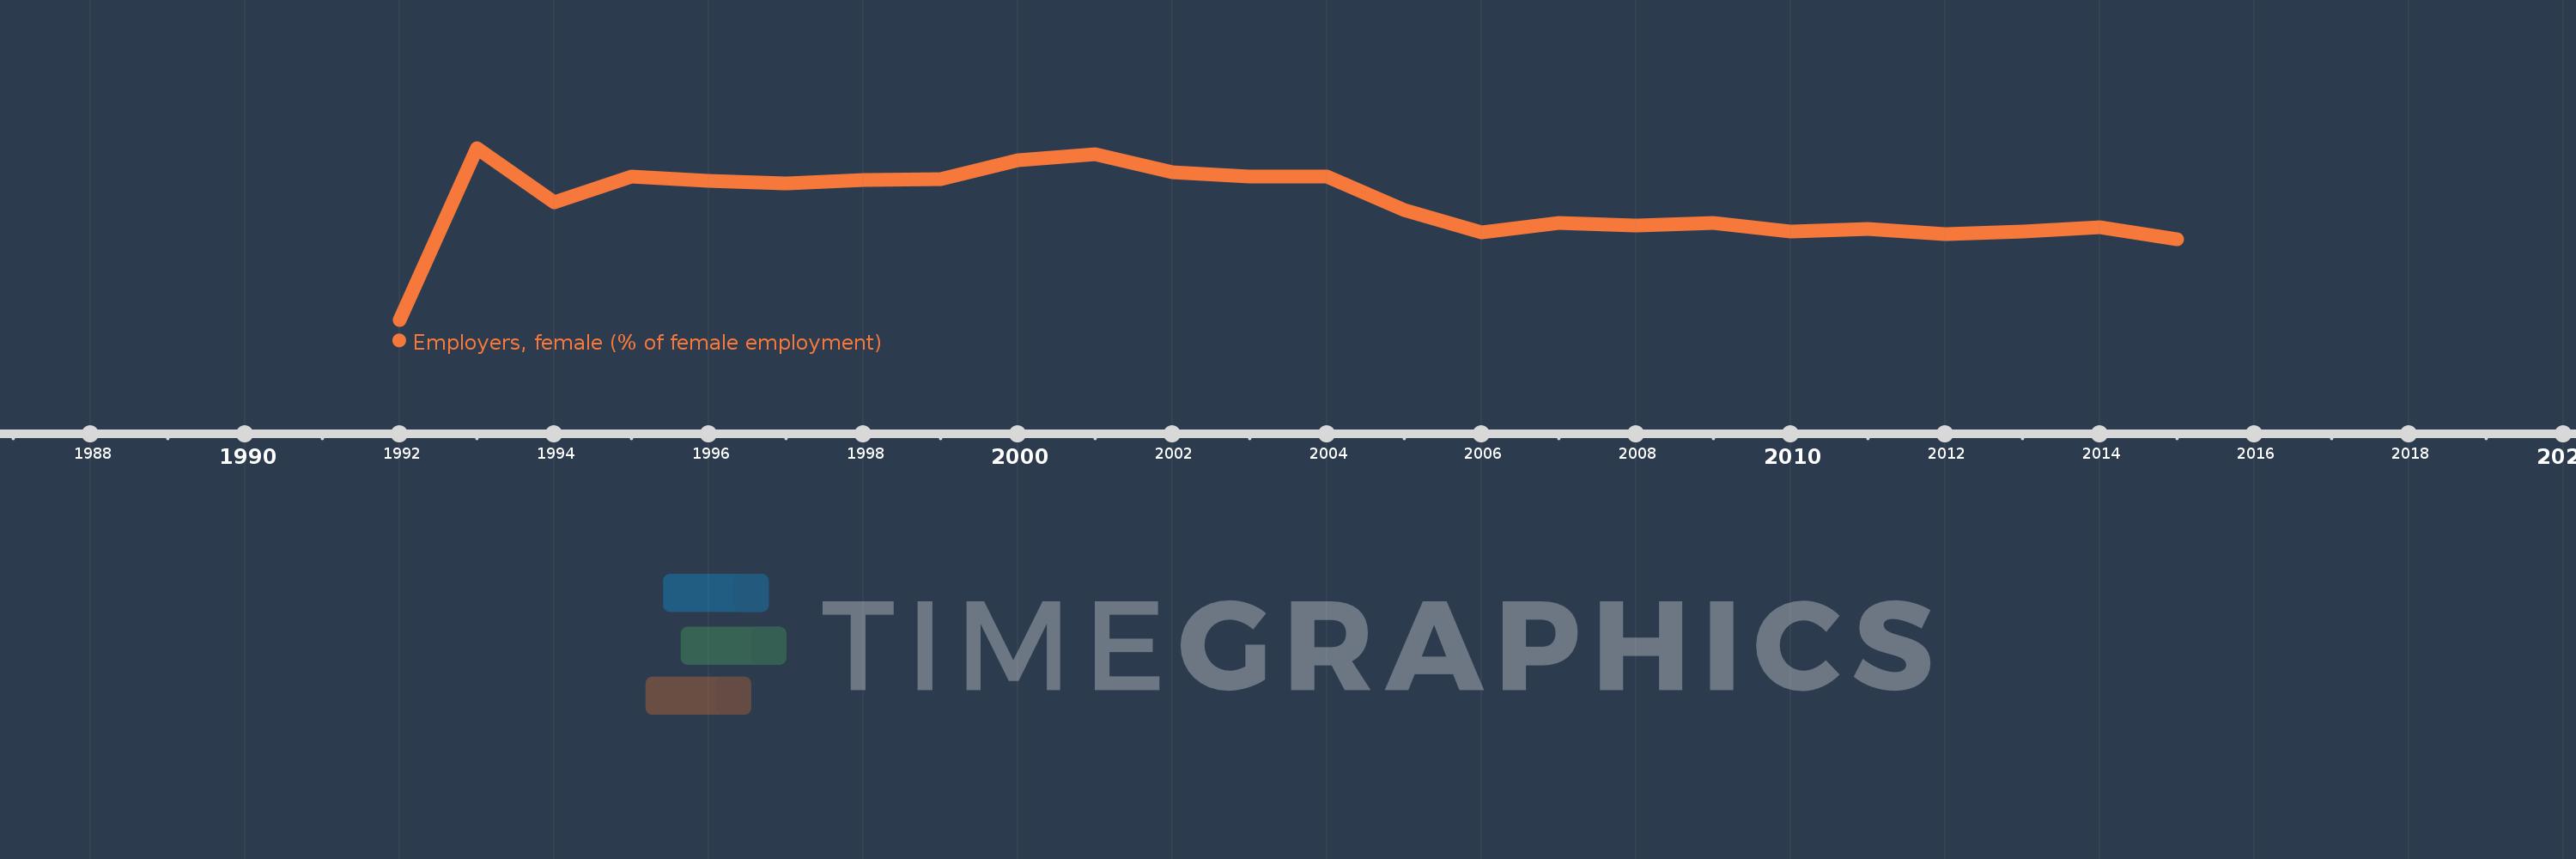
Employers, female (% of female employment)
2015,2014,2013,2012,2011,2010,2009,2008,2007,2006,2005,2004,2003,2002,2001,2000,1999,1998,1997,1996,1995,1994,1993,1992
This statistics in other country:
Timeline:
This timeline shows a graph from 1992 to 2015 of European Union. No data until 1991. Number of actual observations by date: 24.
Source name:
World Development Indicators
Source organization:
ILO Key Indicators of the Labour Market (KILM).
Categories, topics:
Social Protection & Labor, Gender
Last updated:
apr 23, 2017
Indicators value changes by year
At the date of observation
Value
Absolute change
Change from previous value
jan 1, 1992
1.996
+1.996
0.0%
jan 1, 1993
2.8
+0.804
40.28%
jan 1, 1994
2.545
-0.255
-9.1%
jan 1, 1995
2.666
+0.121
4.74%
jan 1, 1996
2.647
-0.019
-0.7%
jan 1, 1997
2.632
-0.015
-0.56%
jan 1, 1998
2.652
+0.02
0.75%
jan 1, 1999
2.654
+0.001
0.05%
jan 1, 2000
2.741
+0.087
3.29%
jan 1, 2001
2.772
+0.032
1.15%
jan 1, 2002
2.686
-0.086
-3.12%
jan 1, 2003
2.668
-0.018
-0.68%
jan 1, 2004
2.668
+0.001
0.02%
jan 1, 2005
2.508
-0.16
-6.0%
jan 1, 2006
2.406
-0.102
-4.06%
jan 1, 2007
2.451
+0.045
1.87%
jan 1, 2008
2.435
-0.016
-0.66%
jan 1, 2009
2.451
+0.015
0.63%
jan 1, 2010
2.408
-0.042
-1.73%
jan 1, 2011
2.421
+0.013
0.54%
jan 1, 2012
2.396
-0.025
-1.03%
jan 1, 2013
2.408
+0.012
0.48%
jan 1, 2014
2.43
+0.022
0.92%
jan 1, 2015
2.372
-0.058
-2.38%
Ranking of countries by current statistics by years


Comments: