29
/
en
AIzaSyAYiBZKx7MnpbEhh9jyipgxe19OcubqV5w
April 1, 2024
30830
Europe & Central Asia
ECS
false
2
1
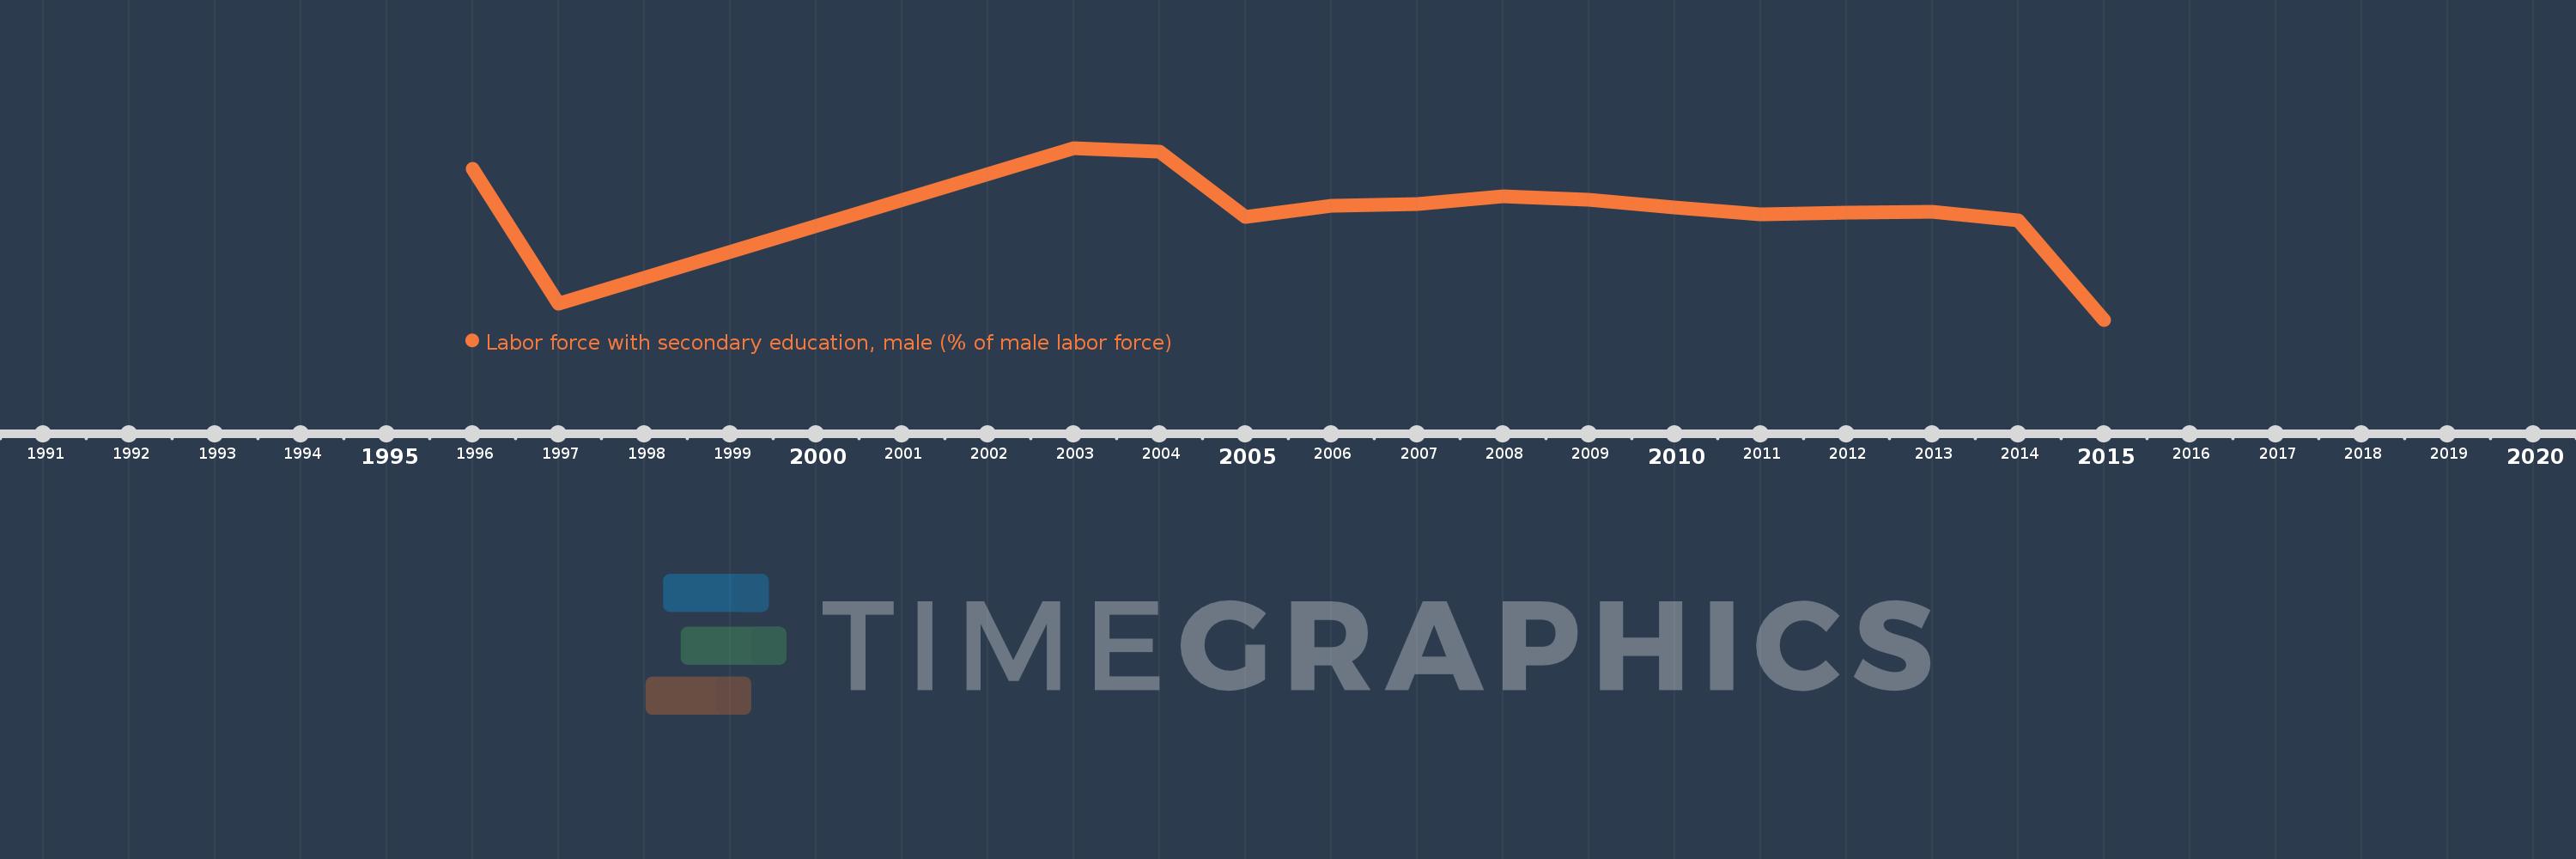
Labor force with secondary education, male (% of male labor force)
2015,2014,2013,2012,2011,2010,2009,2008,2007,2006,2005,2004,2003,1997,1996
This statistics in other country:
Timeline:
This timeline shows a graph from 1996 to 2015 of Europe & Central Asia. No data until 1995. Number of actual observations by date: 15.
Source name:
World Development Indicators
Source organization:
International Labour Organization, Key Indicators of the Labour Market database.
Categories, topics:
Education, Social Protection & Labor, Gender
Last updated:
apr 23, 2017
Indicators value changes by year
Minimum:
42.712
jan 1, 2015
Maximum:
51.039
jan 1, 2003
At the date of observation
Value
Absolute change
Change from previous value
jan 1, 1996
50.032
+50.032
0.0%
jan 1, 1997
43.477
-6.555
-13.1%
jan 1, 2003
51.039
+7.562
17.39%
jan 1, 2004
50.845
-0.194
-0.38%
jan 1, 2005
47.709
-3.137
-6.17%
jan 1, 2006
48.22
+0.511
1.07%
jan 1, 2007
48.328
+0.108
0.22%
jan 1, 2008
48.697
+0.369
0.76%
jan 1, 2009
48.508
-0.189
-0.39%
jan 1, 2010
48.171
-0.337
-0.69%
jan 1, 2011
47.823
-0.348
-0.72%
jan 1, 2012
47.924
+0.1
0.21%
jan 1, 2013
47.929
+0.005
0.01%
jan 1, 2014
47.529
-0.399
-0.83%
jan 1, 2015
42.712
-4.817
-10.14%
Ranking of countries by current statistics by years


Comments: