29
/
en
AIzaSyAYiBZKx7MnpbEhh9jyipgxe19OcubqV5w
April 1, 2024
30419
Europe & Central Asia
ECS
false
2
1
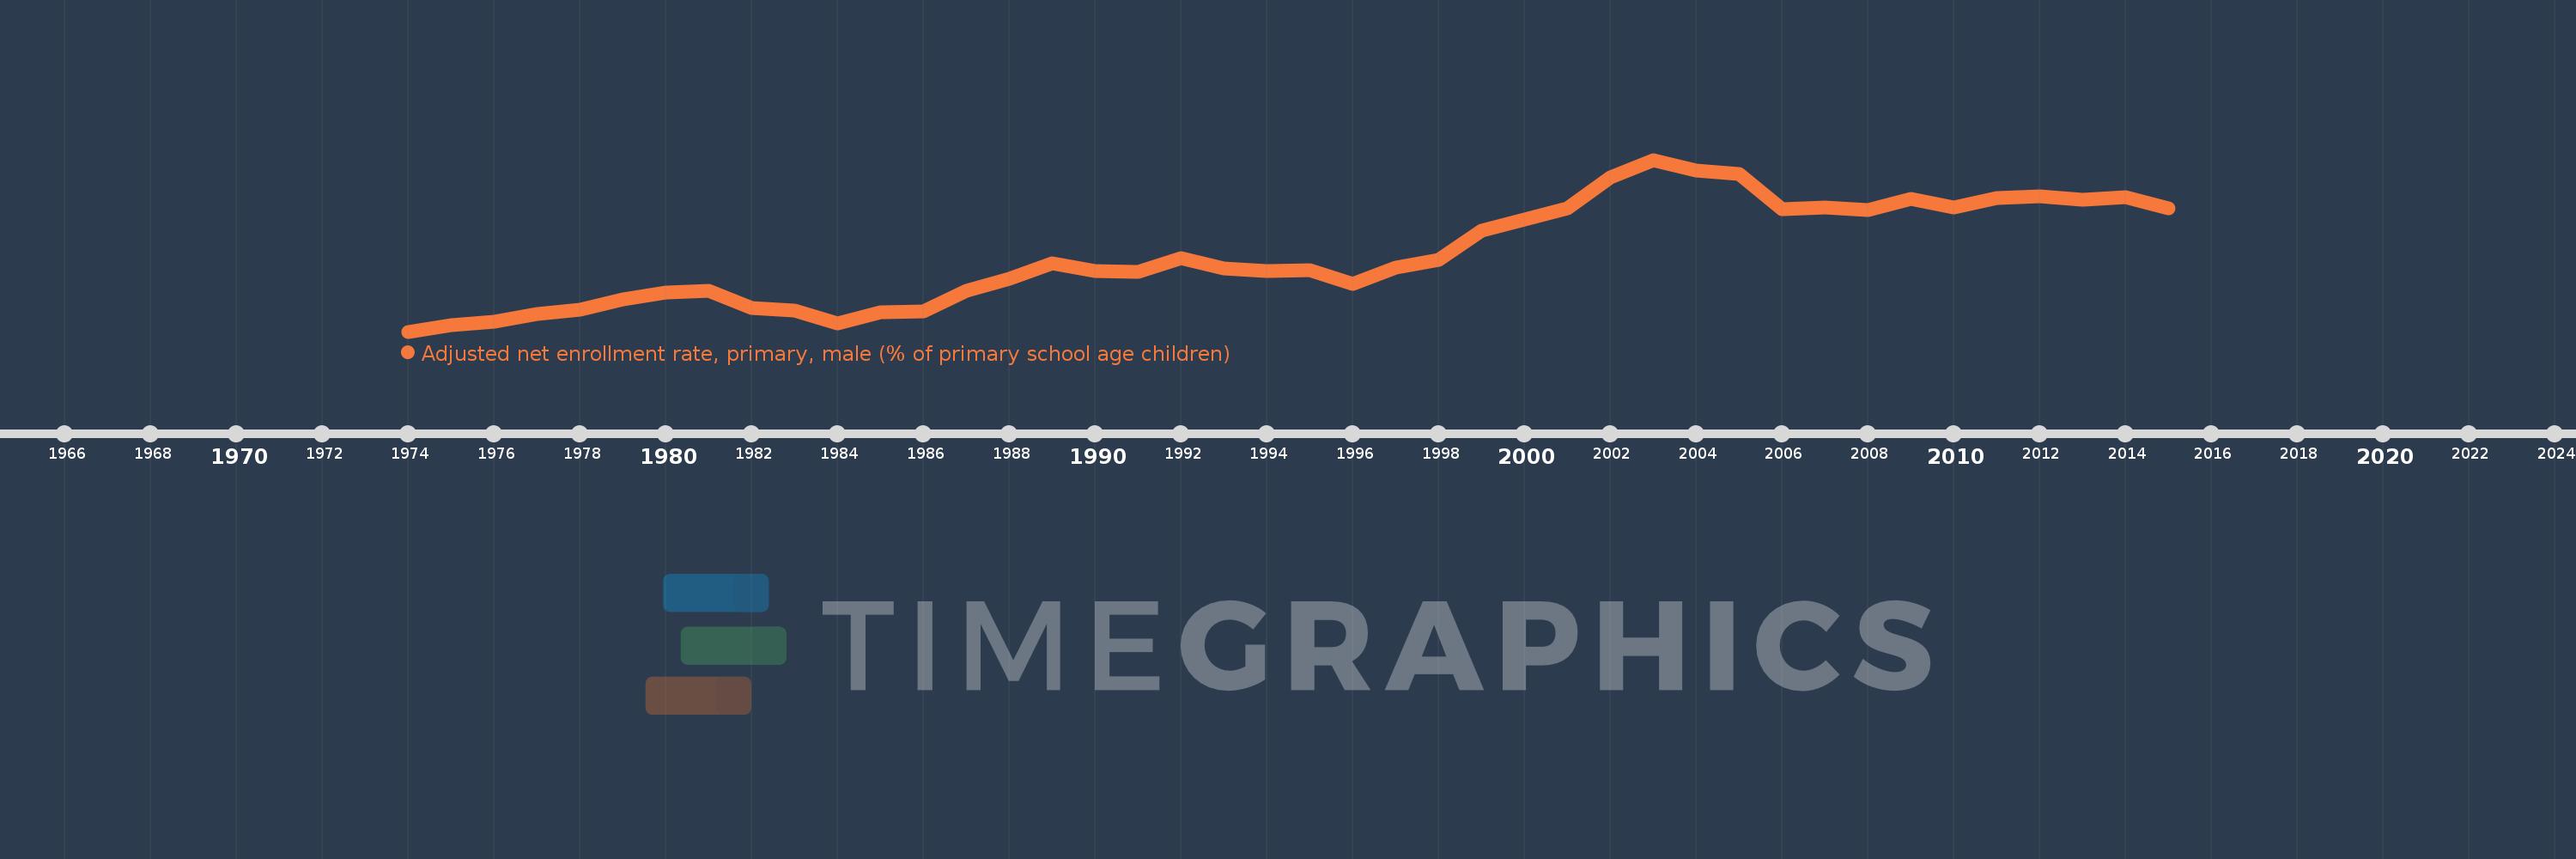
Adjusted net enrollment rate, primary, male (% of primary school age children)
2015,2014,2013,2012,2011,2010,2009,2008,2007,2006,2005,2004,2003,2002,2001,2000,1999,1998,1997,1996,1995,1994,1993,1992,1991,1990,1989,1988,1987,1986,1985,1984,1983,1982,1981,1980,1979,1978,1977,1976,1975,1974
This statistics in other country:
AfghanistanAlbaniaAlgeriaAngolaAntigua and BarbudaArab WorldArgentinaArmeniaArubaAustraliaAustriaAzerbaijanBahamas, TheBahrainBangladeshBarbadosBelarusBelgiumBelizeBeninBermudaBhutanBoliviaBosnia and HerzegovinaBotswanaBrazilBrunei DarussalamBulgariaBurkina FasoBurundiCabo VerdeCambodiaCameroonCanadaCaribbean small statesCentral African RepublicCentral Europe and the BalticsChadChileChinaColombiaComorosCongo, Dem. Rep.Congo, Rep.Costa RicaCote d'IvoireCroatiaCubaCyprusDenmarkDjiboutiDominicaDominican RepublicEarly-demographic dividendEast Asia & PacificEast Asia & Pacific (excluding high income)East Asia & Pacific (IDA & IBRD countries)EcuadorEgypt, Arab Rep.El SalvadorEquatorial GuineaEritreaEstoniaEthiopiaEuro areaEurope & Central AsiaEurope & Central Asia (excluding high income)Europe & Central Asia (IDA & IBRD countries)European UnionFijiFinlandFragile and conflict affected situationsFranceGabonGambia, TheGeorgiaGhanaGreeceGrenadaGuatemalaGuineaGuinea-BissauGuyanaHaitiHeavily indebted poor countries (HIPC)High incomeHondurasHong Kong SAR, ChinaHungaryIBRD onlyIcelandIDA & IBRD totalIDA blendIDA onlyIDA totalIndiaIndonesiaIran, Islamic Rep.IraqIrelandIsraelItalyJamaicaJapanJordanKazakhstanKenyaKiribatiKorea, Dem. People’s Rep.Korea, Rep.KuwaitKyrgyz RepublicLao PDRLate-demographic dividendLatin America & Caribbean Latin America & Caribbean (excluding high income)Latin America & the Caribbean (IDA & IBRD countries)LatviaLeast developed countries: UN classificationLebanonLesothoLiberiaLibyaLiechtensteinLithuaniaLow & middle incomeLow incomeLower middle incomeLuxembourgMacao SAR, ChinaMacedonia, FYRMadagascarMalawiMaldivesMaliMaltaMarshall IslandsMauritaniaMauritiusMexicoMicronesia, Fed. Sts.Middle East & North AfricaMiddle East & North Africa (excluding high income)Middle East & North Africa (IDA & IBRD countries)Middle incomeMoldovaMongoliaMontenegroMoroccoMozambiqueMyanmarNamibiaNauruNepalNetherlandsNew ZealandNicaraguaNigerNigeriaNorth AmericaNorwayOECD membersOmanOther small statesPacific island small statesPakistanPanamaPapua New GuineaParaguayPeruPhilippinesPolandPortugalPost-demographic dividendPre-demographic dividendPuerto RicoQatarRomaniaRussian FederationRwandaSamoaSan MarinoSao Tome and PrincipeSaudi ArabiaSenegalSerbiaSeychellesSierra LeoneSloveniaSmall statesSolomon IslandsSomaliaSouth AfricaSouth AsiaSouth Asia (IDA & IBRD)South SudanSpainSri LankaSt. Kitts and NevisSt. LuciaSt. Vincent and the GrenadinesSub-Saharan Africa Sub-Saharan Africa (excluding high income)Sub-Saharan Africa (IDA & IBRD countries)SudanSurinameSwazilandSwedenSwitzerlandSyrian Arab RepublicTajikistanTanzaniaThailandTimor-LesteTogoTongaTrinidad and TobagoTunisiaTurkeyTuvaluUgandaUkraineUnited Arab EmiratesUnited KingdomUnited StatesUpper middle incomeUruguayUzbekistanVanuatuVenezuela, RBWest Bank and GazaWorldYemen, Rep.ZambiaZimbabwe Timeline:
This timeline shows a graph from 1974 to 2015 of Europe & Central Asia. No data until 1973. Number of actual observations by date: 42.
Source name:
World Development Indicators
Source organization:
United Nations Educational, Scientific, and Cultural Organization (UNESCO) Institute for Statistics.
Categories, topics:
Education, Gender
Last updated:
apr 23, 2017
Indicators value changes by year
Minimum:
93.637
jan 1, 1974
Maximum:
98.355
jan 1, 2003
At the date of observation
Value
Absolute change
Change from previous value
jan 1, 1974
93.637
+93.637
0.0%
jan 1, 1975
93.807
+0.17
0.18%
jan 1, 1976
93.919
+0.112
0.12%
jan 1, 1977
94.131
+0.212
0.23%
jan 1, 1978
94.249
+0.118
0.13%
jan 1, 1979
94.532
+0.282
0.3%
jan 1, 1980
94.716
+0.184
0.19%
jan 1, 1981
94.754
+0.038
0.04%
jan 1, 1982
94.278
-0.476
-0.5%
jan 1, 1983
94.213
-0.065
-0.07%
jan 1, 1984
93.867
-0.346
-0.37%
jan 1, 1985
94.175
+0.308
0.33%
jan 1, 1986
94.196
+0.021
0.02%
jan 1, 1987
94.76
+0.564
0.6%
jan 1, 1988
95.096
+0.335
0.35%
jan 1, 1989
95.504
+0.408
0.43%
jan 1, 1990
95.295
-0.209
-0.22%
jan 1, 1991
95.285
-0.01
-0.01%
jan 1, 1992
95.648
+0.363
0.38%
jan 1, 1993
95.374
-0.274
-0.29%
jan 1, 1994
95.308
-0.066
-0.07%
jan 1, 1995
95.328
+0.02
0.02%
jan 1, 1996
94.936
-0.392
-0.41%
jan 1, 1997
95.388
+0.452
0.48%
jan 1, 1998
95.607
+0.219
0.23%
jan 1, 1999
96.412
+0.805
0.84%
jan 1, 2000
96.718
+0.307
0.32%
jan 1, 2001
97.024
+0.306
0.32%
jan 1, 2002
97.867
+0.843
0.87%
jan 1, 2003
98.355
+0.488
0.5%
jan 1, 2004
98.05
-0.305
-0.31%
jan 1, 2005
97.977
-0.073
-0.07%
jan 1, 2006
96.989
-0.989
-1.01%
jan 1, 2007
97.048
+0.06
0.06%
jan 1, 2008
96.986
-0.062
-0.06%
jan 1, 2009
97.279
+0.292
0.3%
jan 1, 2010
97.051
-0.227
-0.23%
jan 1, 2011
97.315
+0.263
0.27%
jan 1, 2012
97.351
+0.036
0.04%
jan 1, 2013
97.248
-0.103
-0.11%
jan 1, 2014
97.321
+0.073
0.08%
jan 1, 2015
97.012
-0.309
-0.32%
Ranking of countries by current statistics by years


Comments: