29
/
en
AIzaSyAYiBZKx7MnpbEhh9jyipgxe19OcubqV5w
April 1, 2024
29787
Euro area
EMU
false
2
1
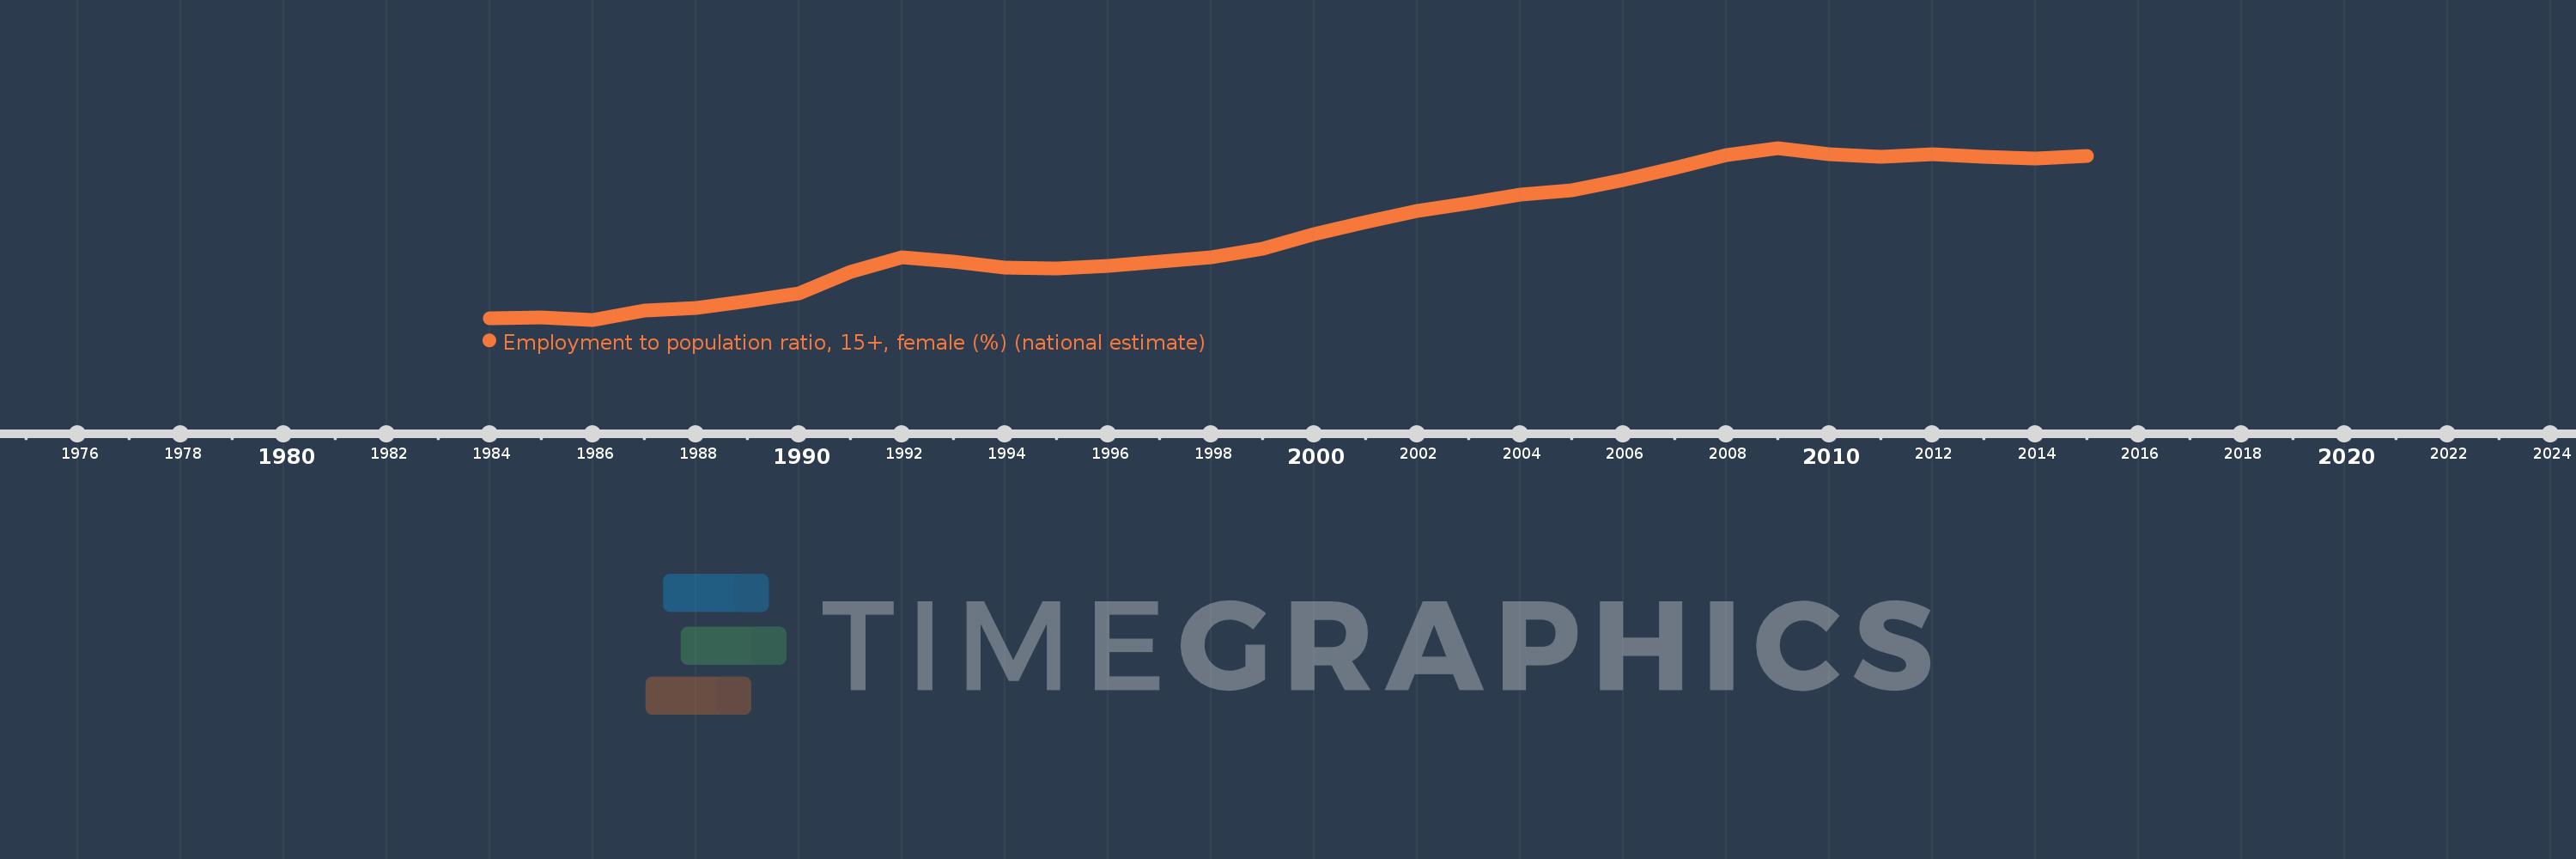
Employment to population ratio, 15+, female (%) (national estimate)
2015,2014,2013,2012,2011,2010,2009,2008,2007,2006,2005,2004,2003,2002,2001,2000,1999,1998,1997,1996,1995,1994,1993,1992,1991,1990,1989,1988,1987,1986,1985,1984
This statistics in other country:
AfghanistanAlbaniaAlgeriaAmerican SamoaAntigua and BarbudaArab WorldArgentinaArmeniaArubaAustraliaAustriaAzerbaijanBahamas, TheBahrainBangladeshBarbadosBelarusBelgiumBelizeBeninBermudaBhutanBoliviaBosnia and HerzegovinaBotswanaBrazilBritish Virgin IslandsBrunei DarussalamBulgariaBurkina FasoBurundiCambodiaCameroonCanadaCaribbean small statesCayman IslandsCentral Europe and the BalticsChadChileColombiaCongo, Dem. Rep.Congo, Rep.Costa RicaCroatiaCubaCyprusCzech RepublicDenmarkDjiboutiDominicaDominican RepublicEarly-demographic dividendEcuadorEgypt, Arab Rep.El SalvadorEstoniaEthiopiaEuro areaEurope & Central AsiaEurope & Central Asia (excluding high income)Europe & Central Asia (IDA & IBRD countries)European UnionFaroe IslandsFijiFinlandFranceFrench PolynesiaGabonGambia, TheGeorgiaGermanyGhanaGreeceGrenadaGuamGuatemalaGuineaGuyanaHaitiHigh incomeHondurasHong Kong SAR, ChinaHungaryIcelandIndiaIndonesiaIran, Islamic Rep.IraqIrelandIsle of ManIsraelItalyJamaicaJapanJordanKazakhstanKenyaKiribatiKorea, Rep.KosovoKuwaitKyrgyz RepublicLao PDRLatin America & Caribbean Latin America & Caribbean (excluding high income)Latin America & the Caribbean (IDA & IBRD countries)LatviaLebanonLesothoLiberiaLibyaLithuaniaLower middle incomeLuxembourgMacao SAR, ChinaMacedonia, FYRMadagascarMalawiMalaysiaMaldivesMaliMaltaMarshall IslandsMauritaniaMauritiusMexicoMiddle East & North AfricaMiddle East & North Africa (excluding high income)Middle East & North Africa (IDA & IBRD countries)MoldovaMonacoMongoliaMontenegroMoroccoMozambiqueNamibiaNepalNetherlandsNew CaledoniaNew ZealandNicaraguaNigerNigeriaNorth AmericaNorthern Mariana IslandsNorwayOECD membersOmanPakistanPanamaParaguayPeruPhilippinesPolandPortugalPost-demographic dividendPuerto RicoQatarRomaniaRussian FederationRwandaSamoaSan MarinoSao Tome and PrincipeSaudi ArabiaSenegalSerbiaSeychellesSierra LeoneSingaporeSlovak RepublicSloveniaSolomon IslandsSouth AfricaSouth AsiaSouth Asia (IDA & IBRD)South SudanSpainSri LankaSt. Kitts and NevisSt. LuciaSudanSurinameSwazilandSwedenSwitzerlandSyrian Arab RepublicTajikistanTanzaniaThailandTimor-LesteTogoTongaTrinidad and TobagoTunisiaTurkeyTuvaluUgandaUkraineUnited Arab EmiratesUnited KingdomUnited StatesUruguayVanuatuVenezuela, RBVietnamWest Bank and GazaYemen, Rep.ZambiaZimbabwe Timeline:
This timeline shows a graph from 1984 to 2015 of Euro area. No data until 1983. Number of actual observations by date: 32.
Source name:
World Development Indicators
Source organization:
International Labour Organization, Key Indicators of the Labour Market database.
Categories, topics:
Social Protection & Labor
Last updated:
apr 23, 2017
Indicators value changes by year
Minimum:
33.685
jan 1, 1986
Maximum:
45.443
jan 1, 2009
At the date of observation
Value
Absolute change
Change from previous value
jan 1, 1984
33.78
+33.78
0.0%
jan 1, 1985
33.861
+0.08
0.24%
jan 1, 1986
33.685
-0.176
-0.52%
jan 1, 1987
34.294
+0.609
1.81%
jan 1, 1988
34.475
+0.181
0.53%
jan 1, 1989
34.983
+0.508
1.47%
jan 1, 1990
35.481
+0.498
1.42%
jan 1, 1991
36.942
+1.46
4.12%
jan 1, 1992
37.941
+0.999
2.7%
jan 1, 1993
37.636
-0.305
-0.8%
jan 1, 1994
37.281
-0.355
-0.94%
jan 1, 1995
37.208
-0.073
-0.2%
jan 1, 1996
37.384
+0.177
0.47%
jan 1, 1997
37.662
+0.277
0.74%
jan 1, 1998
37.96
+0.298
0.79%
jan 1, 1999
38.572
+0.612
1.61%
jan 1, 2000
39.534
+0.962
2.49%
jan 1, 2001
40.386
+0.852
2.16%
jan 1, 2002
41.109
+0.724
1.79%
jan 1, 2003
41.684
+0.575
1.4%
jan 1, 2004
42.276
+0.591
1.42%
jan 1, 2005
42.534
+0.258
0.61%
jan 1, 2006
43.233
+0.7
1.65%
jan 1, 2007
44.09
+0.856
1.98%
jan 1, 2008
44.933
+0.843
1.91%
jan 1, 2009
45.443
+0.511
1.14%
jan 1, 2010
45.01
-0.433
-0.95%
jan 1, 2011
44.816
-0.194
-0.43%
jan 1, 2012
45.014
+0.198
0.44%
jan 1, 2013
44.82
-0.194
-0.43%
jan 1, 2014
44.706
-0.114
-0.25%
jan 1, 2015
44.875
+0.168
0.38%
Ranking of countries by current statistics by years


Comments: