29
/
en
AIzaSyAYiBZKx7MnpbEhh9jyipgxe19OcubqV5w
April 1, 2024
29358
East Asia & Pacific (IDA & IBRD countries)
TEA
false
2
1
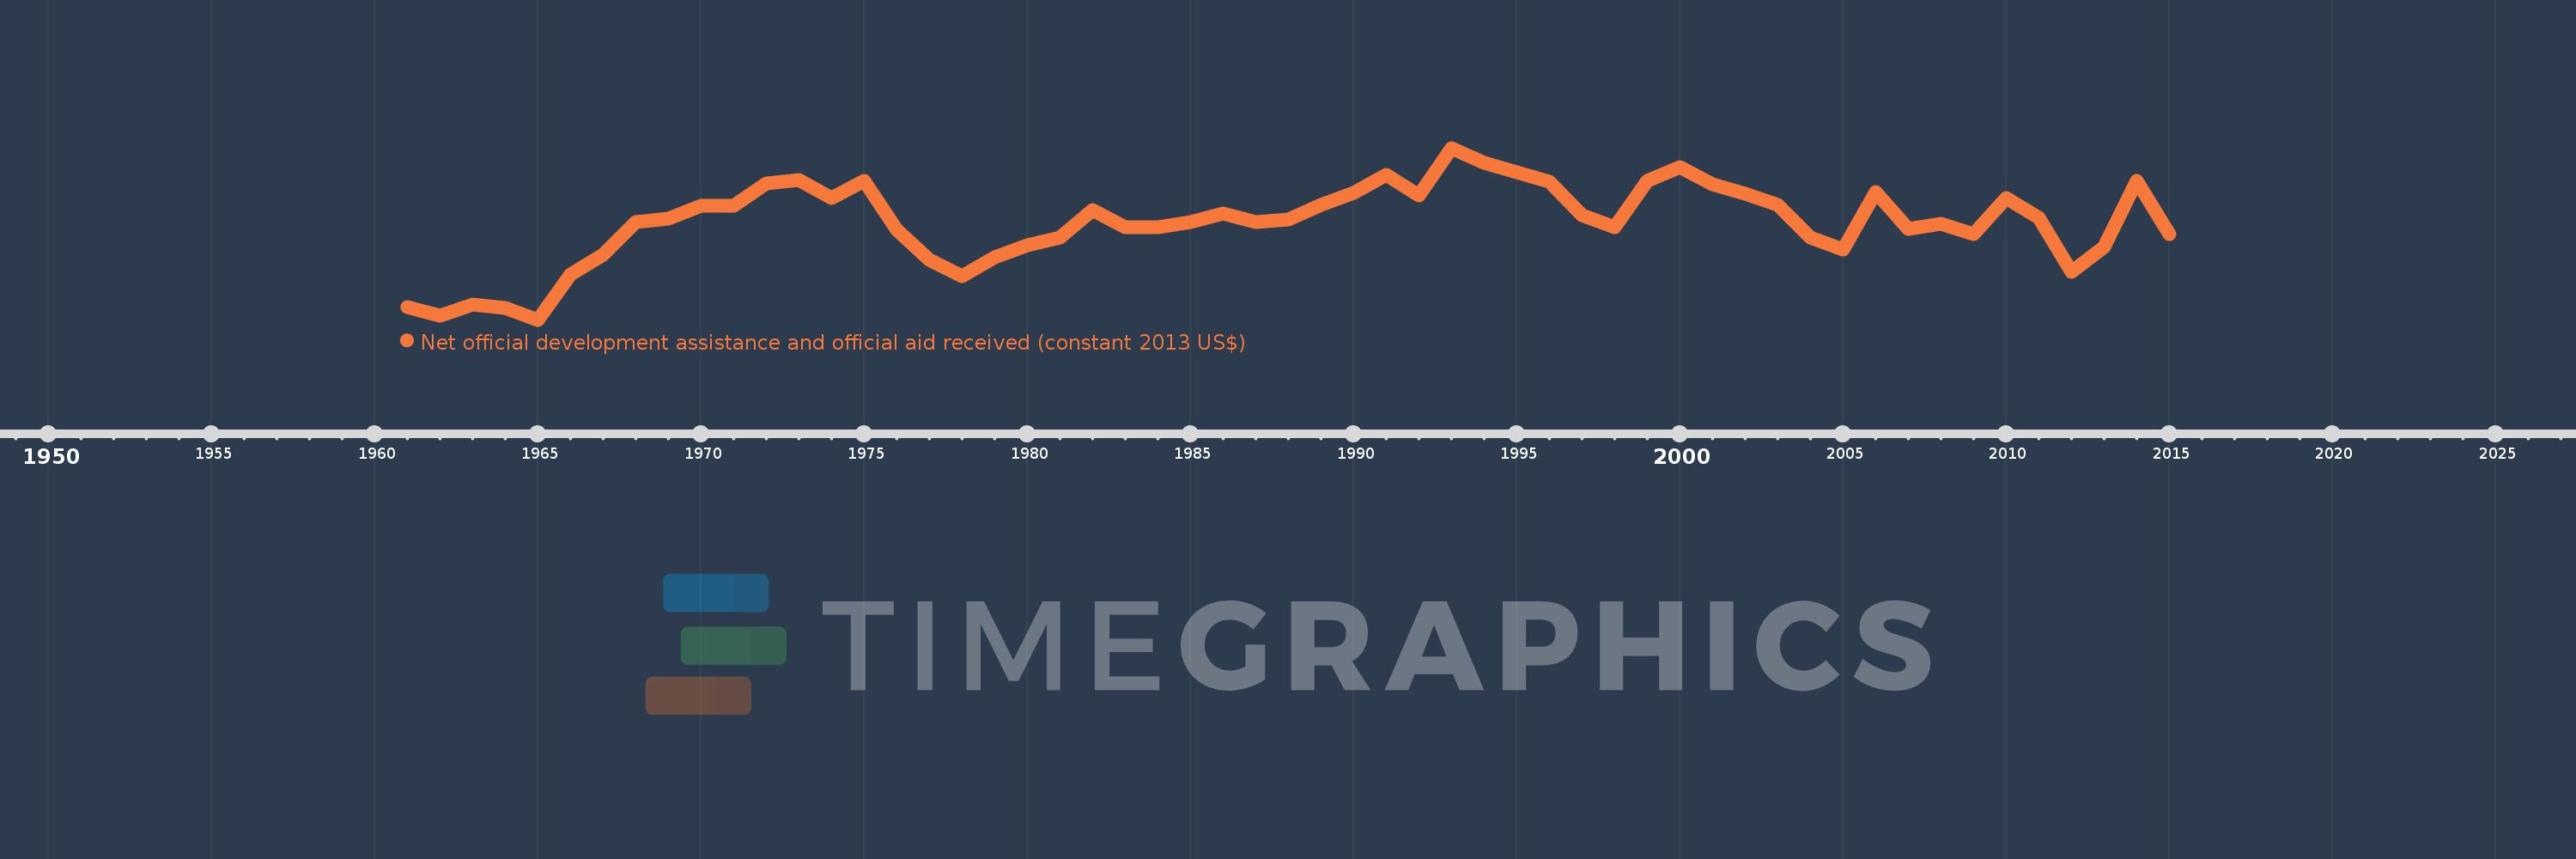
Net official development assistance and official aid received (constant 2013 US$)
2015,2014,2013,2012,2011,2010,2009,2008,2007,2006,2005,2004,2003,2002,2001,2000,1999,1998,1997,1996,1995,1994,1993,1992,1991,1990,1989,1988,1987,1986,1985,1984,1983,1982,1981,1980,1979,1978,1977,1976,1975,1974,1973,1972,1971,1970,1969,1968,1967,1966,1965,1964,1963,1962,1961
This statistics in other country:
AfghanistanAlbaniaAlgeriaAngolaAntigua and BarbudaArab WorldArgentinaArmeniaArubaAzerbaijanBahamas, TheBahrainBangladeshBarbadosBelarusBelizeBeninBermudaBhutanBoliviaBosnia and HerzegovinaBotswanaBrazilBritish Virgin IslandsBrunei DarussalamBulgariaBurkina FasoBurundiCabo VerdeCambodiaCameroonCaribbean small statesCayman IslandsCentral African RepublicCentral Europe and the BalticsChadChileChinaColombiaComorosCongo, Dem. Rep.Congo, Rep.Costa RicaCote d'IvoireCroatiaCubaCyprusCzech RepublicDjiboutiDominicaDominican RepublicEast Asia & PacificEast Asia & Pacific (excluding high income)East Asia & Pacific (IDA & IBRD countries)EcuadorEgypt, Arab Rep.El SalvadorEquatorial GuineaEritreaEstoniaEthiopiaEuro areaEurope & Central AsiaEurope & Central Asia (excluding high income)Europe & Central Asia (IDA & IBRD countries)European UnionFijiFragile and conflict affected situationsFrench PolynesiaGabonGambia, TheGeorgiaGhanaGibraltarGrenadaGuatemalaGuineaGuinea-BissauGuyanaHaitiHeavily indebted poor countries (HIPC)High incomeHondurasHong Kong SAR, ChinaHungaryIBRD onlyIDA & IBRD totalIDA blendIDA onlyIDA totalIndiaIndonesiaIran, Islamic Rep.IraqIsraelJamaicaJordanKazakhstanKenyaKiribatiKorea, Dem. People’s Rep.Korea, Rep.KosovoKuwaitKyrgyz RepublicLao PDRLatin America & Caribbean Latin America & Caribbean (excluding high income)Latin America & the Caribbean (IDA & IBRD countries)LatviaLeast developed countries: UN classificationLebanonLesothoLiberiaLibyaLithuaniaLow & middle incomeLow incomeLower middle incomeMacao SAR, ChinaMacedonia, FYRMadagascarMalawiMalaysiaMaldivesMaliMaltaMarshall IslandsMauritaniaMauritiusMexicoMicronesia, Fed. Sts.Middle East & North AfricaMiddle East & North Africa (excluding high income)Middle East & North Africa (IDA & IBRD countries)Middle incomeMoldovaMongoliaMontenegroMoroccoMozambiqueMyanmarNamibiaNauruNepalNew CaledoniaNicaraguaNigerNigeriaNorth AmericaNorthern Mariana IslandsOECD membersOmanOther small statesPacific island small statesPakistanPalauPanamaPapua New GuineaParaguayPeruPhilippinesPolandQatarRomaniaRussian FederationRwandaSamoaSao Tome and PrincipeSaudi ArabiaSenegalSerbiaSeychellesSierra LeoneSingaporeSlovak RepublicSloveniaSmall statesSolomon IslandsSomaliaSouth AfricaSouth AsiaSouth Asia (IDA & IBRD)South SudanSri LankaSt. Kitts and NevisSt. LuciaSt. Vincent and the GrenadinesSub-Saharan Africa Sub-Saharan Africa (excluding high income)Sub-Saharan Africa (IDA & IBRD countries)SudanSurinameSwazilandSyrian Arab RepublicTajikistanTanzaniaThailandTimor-LesteTogoTongaTrinidad and TobagoTunisiaTurkeyTurkmenistanTurks and Caicos IslandsTuvaluUgandaUkraineUnited Arab EmiratesUpper middle incomeUruguayUzbekistanVanuatuVenezuela, RBVietnamWest Bank and GazaWorldYemen, Rep.ZambiaZimbabwe Timeline:
This timeline shows a graph from 1961 to 2015 of East Asia & Pacific (IDA & IBRD countries). No data until 1960. Number of actual observations by date: 55.
Source name:
World Development Indicators
Source organization:
Development Assistance Committee of the Organisation for Economic Co-operation and Development, Geographical Distribution of Financial Flows to Developing Countries, Development Co-operation Report, and International Development Statistics database. Data are available online at: www.oecd.org/dac/stats/idsonline.
Categories, topics:
Aid Effectiveness
Last updated:
apr 23, 2017
Indicators value changes by year
Minimum:
4.692 bln
jan 1, 1965
Maximum:
12.603 bln
jan 1, 1993
At the date of observation
Value
Absolute change
Change from previous value
jan 1, 1961
5.282 bln
+5.282 bln
0.0%
jan 1, 1962
4.896 bln
-385.68 mln
-7.3%
jan 1, 1963
5.408 bln
+512.09 mln
10.46%
jan 1, 1964
5.241 bln
-167.41 mln
-3.1%
jan 1, 1965
4.692 bln
-548.58 mln
-10.47%
jan 1, 1966
6.758 bln
+2.066 bln
44.02%
jan 1, 1967
7.687 bln
+929.08 mln
13.75%
jan 1, 1968
9.178 bln
+1.49 bln
19.39%
jan 1, 1969
9.337 bln
+159.33 mln
1.74%
jan 1, 1970
9.928 bln
+591.66 mln
6.34%
jan 1, 1971
9.932 bln
+3.58 mln
0.04%
jan 1, 1972
10.966 bln
+1.034 bln
10.41%
jan 1, 1973
11.146 bln
+179.97 mln
1.64%
jan 1, 1974
10.305 bln
-840.76 mln
-7.54%
jan 1, 1975
11.08 bln
+774.41 mln
7.51%
jan 1, 1976
8.84 bln
-2.24 bln
-20.22%
jan 1, 1977
7.458 bln
-1.381 bln
-15.63%
jan 1, 1978
6.686 bln
-772.57 mln
-10.36%
jan 1, 1979
7.579 bln
+893.65 mln
13.37%
jan 1, 1980
8.116 bln
+536.33 mln
7.08%
jan 1, 1981
8.468 bln
+352.59 mln
4.34%
jan 1, 1982
9.726 bln
+1.257 bln
14.85%
jan 1, 1983
8.937 bln
-788.42 mln
-8.11%
jan 1, 1984
8.934 bln
-3.28 mln
-0.04%
jan 1, 1985
9.187 bln
+252.87 mln
2.83%
jan 1, 1986
9.593 bln
+405.99 mln
4.42%
jan 1, 1987
9.18 bln
-412.71 mln
-4.3%
jan 1, 1988
9.289 bln
+109.34 mln
1.19%
jan 1, 1989
9.97 bln
+680.76 mln
7.33%
jan 1, 1990
10.547 bln
+576.82 mln
5.79%
jan 1, 1991
11.367 bln
+819.68 mln
7.77%
jan 1, 1992
10.4 bln
-966.44 mln
-8.5%
jan 1, 1993
12.603 bln
+2.203 bln
21.18%
jan 1, 1994
11.91 bln
-693.3 mln
-5.5%
jan 1, 1995
11.503 bln
-407.58 mln
-3.42%
jan 1, 1996
11.045 bln
-457.81 mln
-3.98%
jan 1, 1997
9.497 bln
-1.548 bln
-14.02%
jan 1, 1998
8.968 bln
-528.55 mln
-5.57%
jan 1, 1999
11.09 bln
+2.122 bln
23.66%
jan 1, 2000
11.735 bln
+644.93 mln
5.82%
jan 1, 2001
10.921 bln
-814.15 mln
-6.94%
jan 1, 2002
10.487 bln
-433.85 mln
-3.97%
jan 1, 2003
9.98 bln
-507.3 mln
-4.84%
jan 1, 2004
8.463 bln
-1.517 bln
-15.2%
jan 1, 2005
7.922 bln
-541.39 mln
-6.4%
jan 1, 2006
10.586 bln
+2.664 bln
33.63%
jan 1, 2007
8.86 bln
-1.726 bln
-16.31%
jan 1, 2008
9.13 bln
+270.23 mln
3.05%
jan 1, 2009
8.634 bln
-496.45 mln
-5.44%
jan 1, 2010
10.316 bln
+1.682 bln
19.48%
jan 1, 2011
9.407 bln
-909.38 mln
-8.82%
jan 1, 2012
6.903 bln
-2.504 bln
-26.62%
jan 1, 2013
8.059 bln
+1.156 bln
16.75%
jan 1, 2014
11.101 bln
+3.042 bln
37.74%
jan 1, 2015
8.626 bln
-2.475 bln
-22.29%
Ranking of countries by current statistics by years


Comments: