29
/
en
AIzaSyAYiBZKx7MnpbEhh9jyipgxe19OcubqV5w
April 1, 2024
28889
East Asia & Pacific (IDA & IBRD countries)
TEA
false
2
1
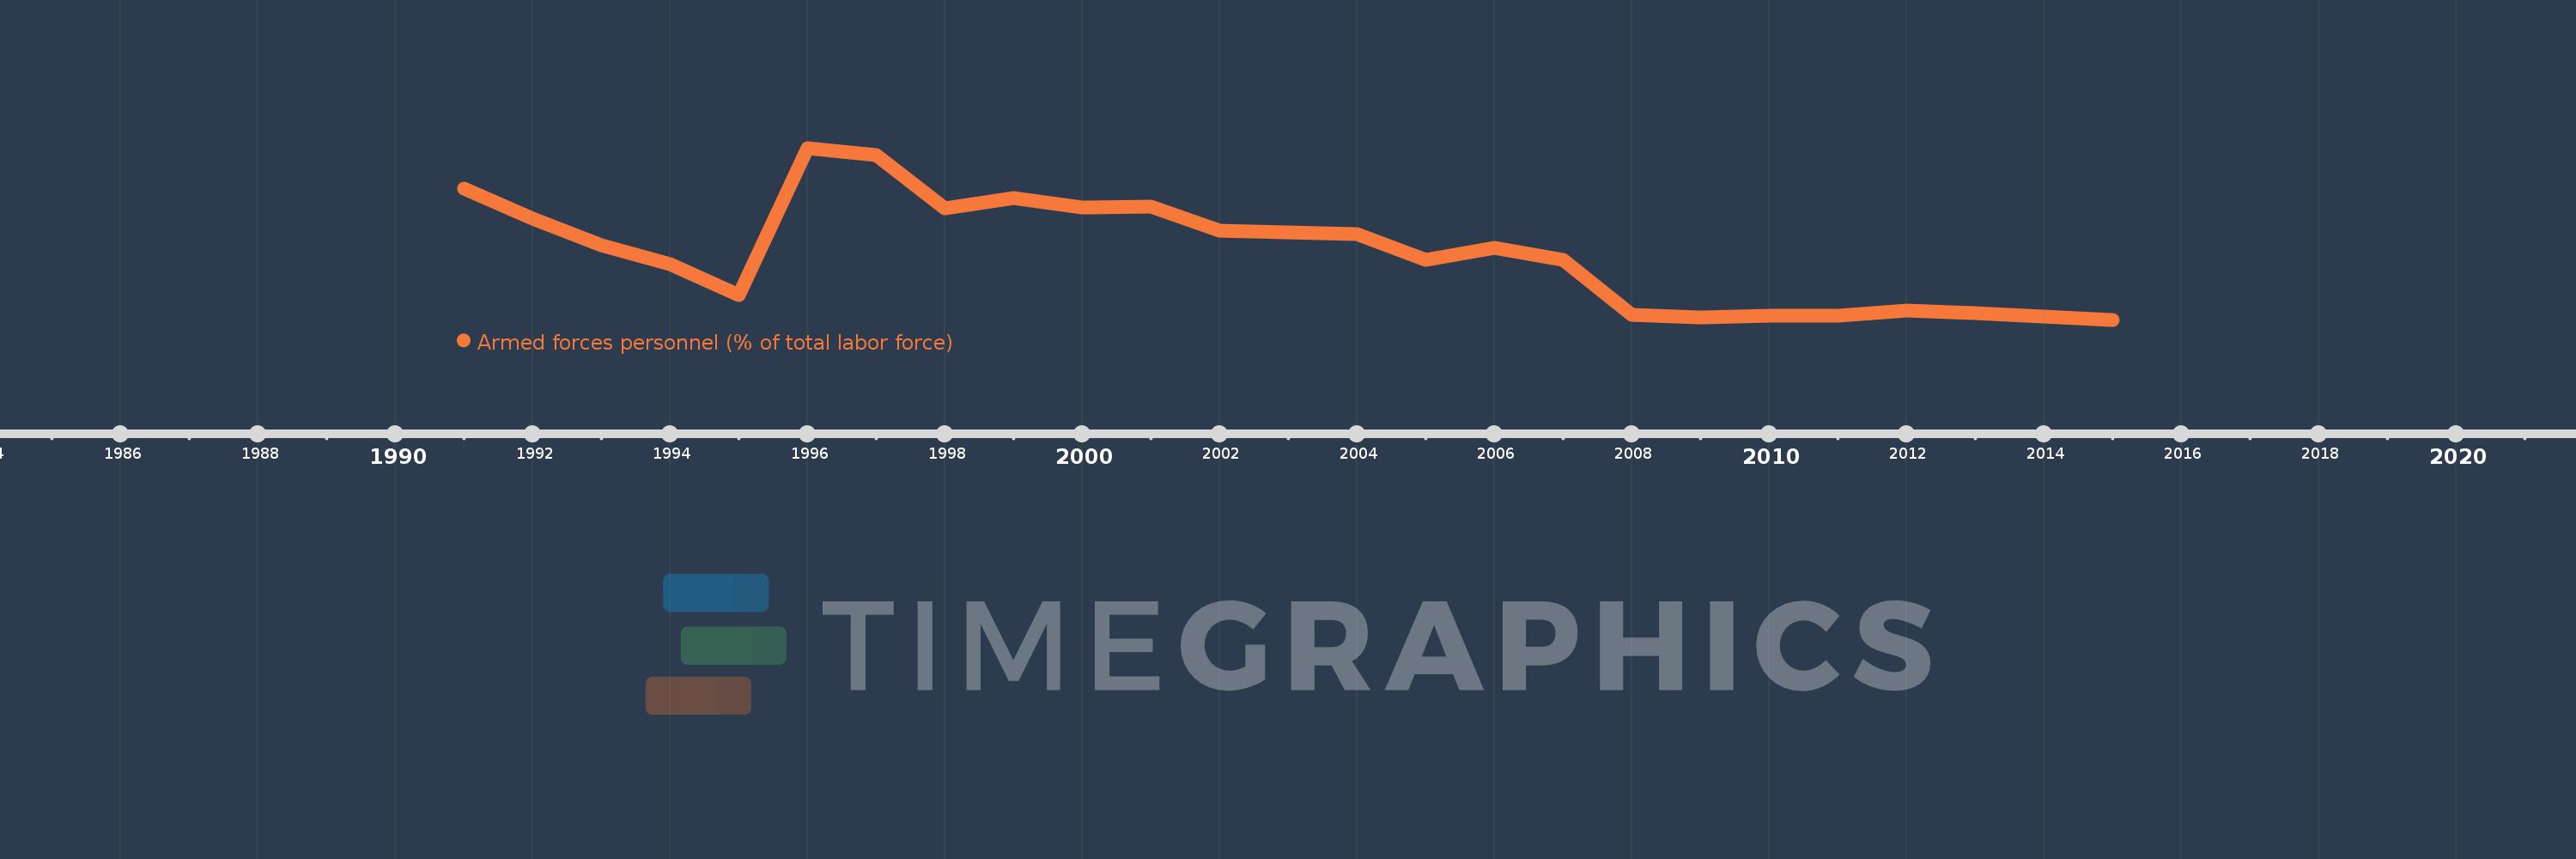
Armed forces personnel (% of total labor force)
2015,2014,2013,2012,2011,2010,2009,2008,2007,2006,2005,2004,2003,2002,2001,2000,1999,1998,1997,1996,1995,1994,1993,1992,1991
This statistics in other country:
AfghanistanAlbaniaAlgeriaAngolaArab WorldArgentinaArmeniaAustraliaAustriaAzerbaijanBahamas, TheBahrainBangladeshBarbadosBelarusBelgiumBelizeBeninBhutanBoliviaBosnia and HerzegovinaBotswanaBrazilBrunei DarussalamBulgariaBurkina FasoBurundiCabo VerdeCambodiaCameroonCanadaCaribbean small statesCentral African RepublicCentral Europe and the BalticsChadChileChinaColombiaCongo, Dem. Rep.Congo, Rep.Costa RicaCote d'IvoireCroatiaCubaCyprusCzech RepublicDenmarkDjiboutiDominican RepublicEarly-demographic dividendEast Asia & PacificEast Asia & Pacific (excluding high income)East Asia & Pacific (IDA & IBRD countries)EcuadorEgypt, Arab Rep.El SalvadorEquatorial GuineaEritreaEstoniaEthiopiaEuro areaEurope & Central AsiaEurope & Central Asia (excluding high income)Europe & Central Asia (IDA & IBRD countries)European UnionFijiFinlandFragile and conflict affected situationsFranceGabonGambia, TheGeorgiaGermanyGhanaGreeceGuatemalaGuineaGuinea-BissauGuyanaHaitiHeavily indebted poor countries (HIPC)High incomeHondurasHungaryIBRD onlyIcelandIDA & IBRD totalIDA blendIDA onlyIDA totalIndiaIndonesiaIran, Islamic Rep.IraqIrelandIsraelItalyJamaicaJapanJordanKazakhstanKenyaKorea, Dem. People’s Rep.Korea, Rep.KuwaitKyrgyz RepublicLao PDRLate-demographic dividendLatin America & Caribbean Latin America & Caribbean (excluding high income)Latin America & the Caribbean (IDA & IBRD countries)LatviaLeast developed countries: UN classificationLebanonLesothoLiberiaLibyaLithuaniaLow & middle incomeLow incomeLower middle incomeLuxembourgMacedonia, FYRMadagascarMalawiMalaysiaMaldivesMaliMaltaMauritaniaMauritiusMexicoMiddle East & North AfricaMiddle East & North Africa (excluding high income)Middle East & North Africa (IDA & IBRD countries)Middle incomeMoldovaMongoliaMontenegroMoroccoMozambiqueMyanmarNamibiaNepalNetherlandsNew ZealandNicaraguaNigerNigeriaNorth AmericaNorwayOECD membersOmanOther small statesPakistanPanamaPapua New GuineaParaguayPeruPhilippinesPolandPortugalPost-demographic dividendPre-demographic dividendQatarRomaniaRussian FederationRwandaSao Tome and PrincipeSaudi ArabiaSenegalSerbiaSierra LeoneSingaporeSlovak RepublicSloveniaSmall statesSomaliaSouth AfricaSouth AsiaSouth Asia (IDA & IBRD)SpainSri LankaSub-Saharan Africa Sub-Saharan Africa (excluding high income)Sub-Saharan Africa (IDA & IBRD countries)SudanSurinameSwazilandSwedenSwitzerlandSyrian Arab RepublicTajikistanTanzaniaThailandTimor-LesteTogoTrinidad and TobagoTunisiaTurkeyTurkmenistanUgandaUkraineUnited Arab EmiratesUnited KingdomUnited StatesUpper middle incomeUruguayUzbekistanVenezuela, RBVietnamWest Bank and GazaWorldYemen, Rep.ZambiaZimbabwe Timeline:
This timeline shows a graph from 1991 to 2015 of East Asia & Pacific (IDA & IBRD countries). No data until 1990. Number of actual observations by date: 25.
Source name:
World Development Indicators
Source organization:
International Institute for Strategic Studies, The Military Balance.
Categories, topics:
Public Sector
Last updated:
apr 23, 2017
Indicators value changes by year
At the date of observation
Value
Absolute change
Change from previous value
jan 1, 1991
0.692
+0.692
0.0%
jan 1, 1992
0.651
-0.041
-5.92%
jan 1, 1993
0.615
-0.036
-5.53%
jan 1, 1994
0.589
-0.026
-4.27%
jan 1, 1995
0.547
-0.042
-7.06%
jan 1, 1996
0.747
+0.199
36.45%
jan 1, 1997
0.737
-0.01
-1.32%
jan 1, 1998
0.665
-0.071
-9.68%
jan 1, 1999
0.679
+0.014
2.07%
jan 1, 2000
0.666
-0.013
-1.97%
jan 1, 2001
0.667
+0.001
0.2%
jan 1, 2002
0.635
-0.032
-4.84%
jan 1, 2003
0.633
-0.002
-0.29%
jan 1, 2004
0.63
-0.003
-0.51%
jan 1, 2005
0.595
-0.035
-5.54%
jan 1, 2006
0.611
+0.017
2.78%
jan 1, 2007
0.595
-0.017
-2.76%
jan 1, 2008
0.521
-0.074
-12.38%
jan 1, 2009
0.517
-0.004
-0.83%
jan 1, 2010
0.52
+0.003
0.56%
jan 1, 2011
0.519
0.0
-0.08%
jan 1, 2012
0.526
+0.007
1.3%
jan 1, 2013
0.523
-0.003
-0.53%
jan 1, 2014
0.518
-0.005
-0.95%
jan 1, 2015
0.514
-0.004
-0.85%
Ranking of countries by current statistics by years


Comments: