29
/
en
AIzaSyAYiBZKx7MnpbEhh9jyipgxe19OcubqV5w
April 1, 2024
285649
Zambia
ZMB
true
2
1
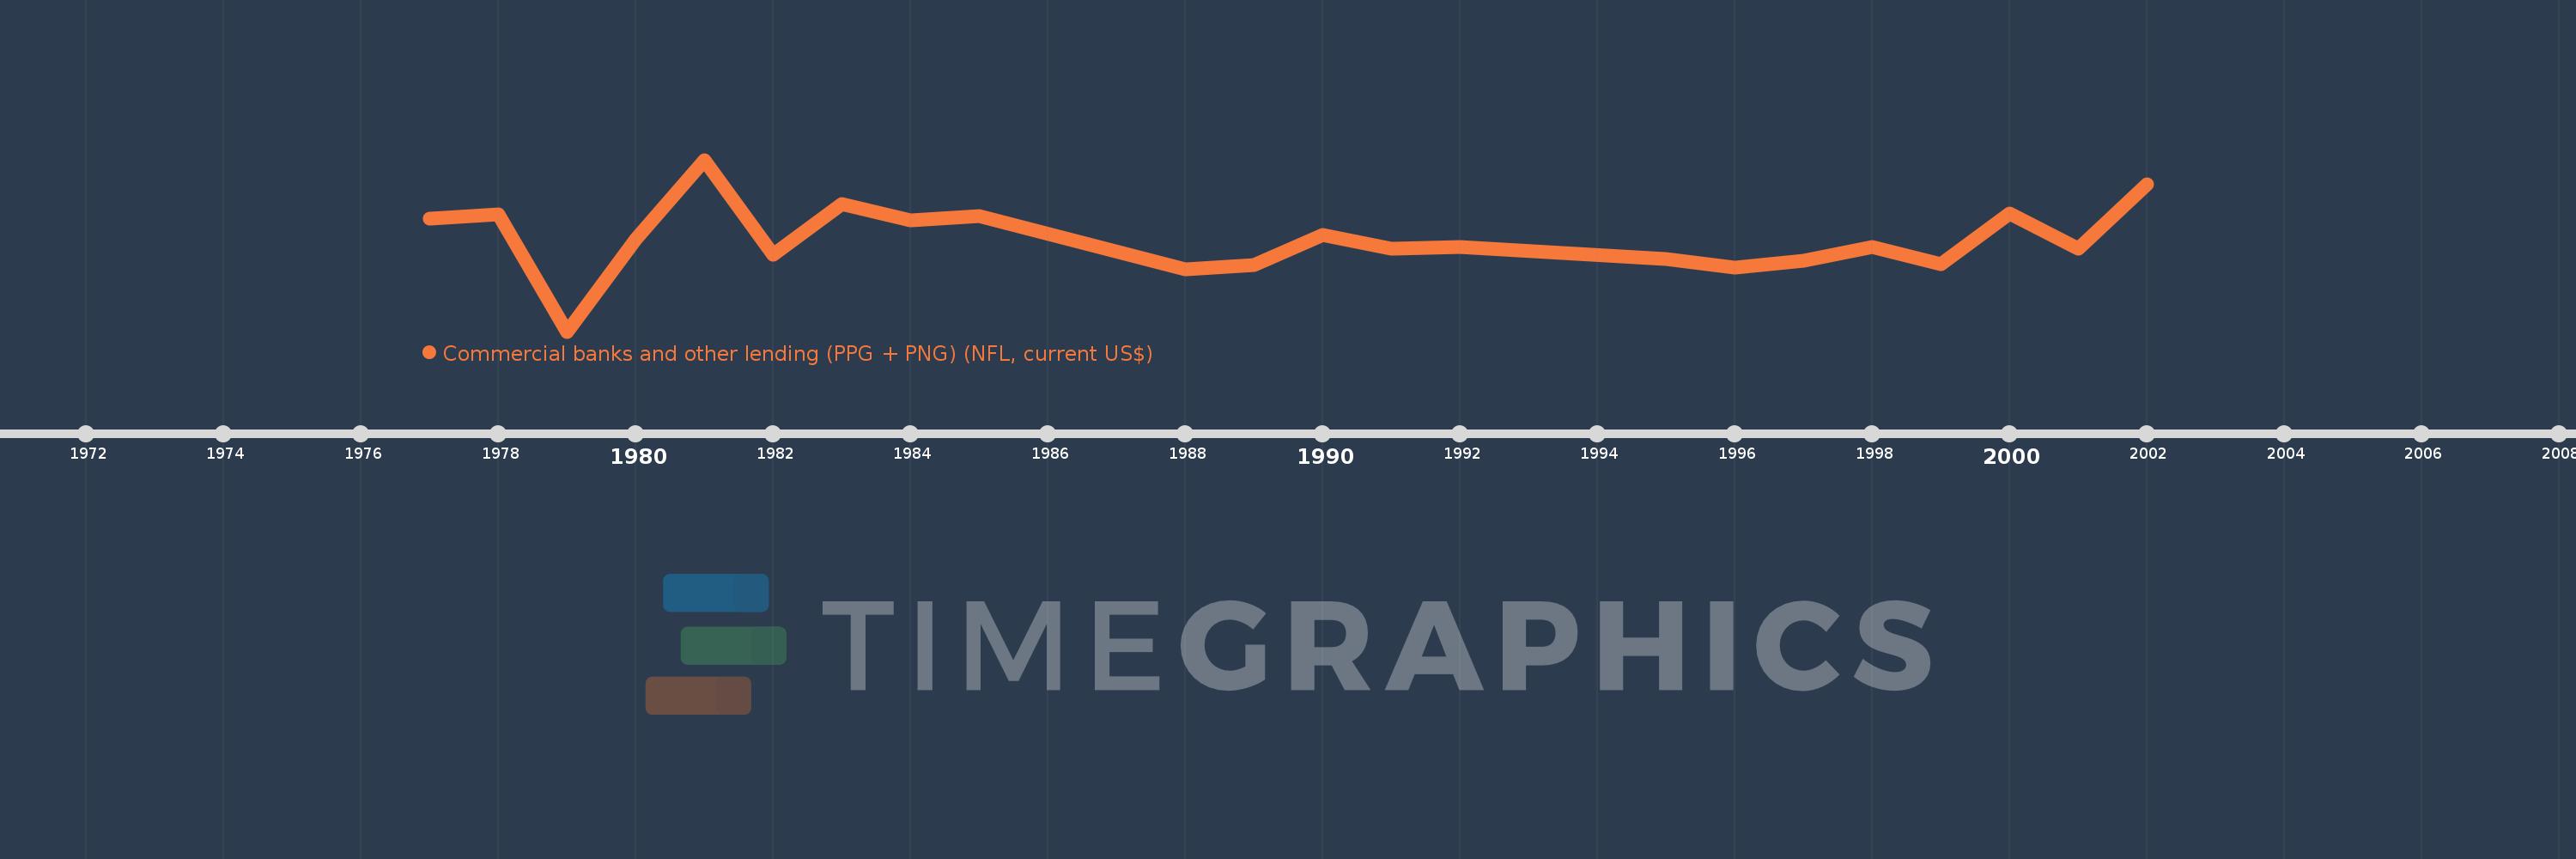
Commercial banks and other lending (PPG + PNG) (NFL, current US$)
2002,2001,2000,1999,1998,1997,1996,1995,1992,1991,1990,1989,1988,1985,1984,1983,1982,1981,1980,1979,1978,1977
This statistics in other country:
Timeline:
This timeline shows a graph from 1977 to 2002 of Zambia. No data until 1976. Number of actual observations by date: 22.
Source name:
World Development Indicators
Source organization:
World Bank, International Debt Statistics.
Categories, topics:
External Debt
Last updated:
apr 23, 2017
Indicators value changes by year
Minimum:
-128.955 mln
jan 1, 1979
Maximum:
119.141 mln
jan 1, 1981
At the date of observation
Value
Absolute change
Change from previous value
jan 1, 1977
34.677 mln
+34.677 mln
0.0%
jan 1, 1978
40.752 mln
+6.075 mln
17.52%
jan 1, 1979
-128.955 mln
-169.707 mln
-416.44%
jan 1, 1980
4.581 mln
+133.536 mln
-103.55%
jan 1, 1981
119.141 mln
+114.56 mln
2.5K%
jan 1, 1982
-18.273 mln
-137.414 mln
-115.34%
jan 1, 1983
55.28 mln
+73.553 mln
-402.52%
jan 1, 1984
32.118 mln
-23.162 mln
-41.9%
jan 1, 1985
37.887 mln
+5.769 mln
17.96%
jan 1, 1988
-38.963 mln
-76.85 mln
-202.84%
jan 1, 1989
-32.724 mln
+6.239 mln
-16.01%
jan 1, 1990
10.12 mln
+42.844 mln
-130.93%
jan 1, 1991
-9.301 mln
-19.421 mln
-191.91%
jan 1, 1992
-7.095 mln
+2.206 mln
-23.72%
jan 1, 1995
-24.546 mln
-17.451 mln
245.96%
jan 1, 1996
-36.852 mln
-12.306 mln
50.13%
jan 1, 1997
-26.193 mln
+10.659 mln
-28.92%
jan 1, 1998
-7.126 mln
+19.067 mln
-72.79%
jan 1, 1999
-31.861 mln
-24.735 mln
347.11%
jan 1, 2000
42.108 mln
+73.969 mln
-232.16%
jan 1, 2001
-8.901 mln
-51.009 mln
-121.14%
jan 1, 2002
84.383 mln
+93.284 mln
-1.05K%
Ranking of countries by current statistics by years


Comments: