29
/
en
AIzaSyAYiBZKx7MnpbEhh9jyipgxe19OcubqV5w
April 1, 2024
285208
Yemen, Rep.
YEM
true
2
1
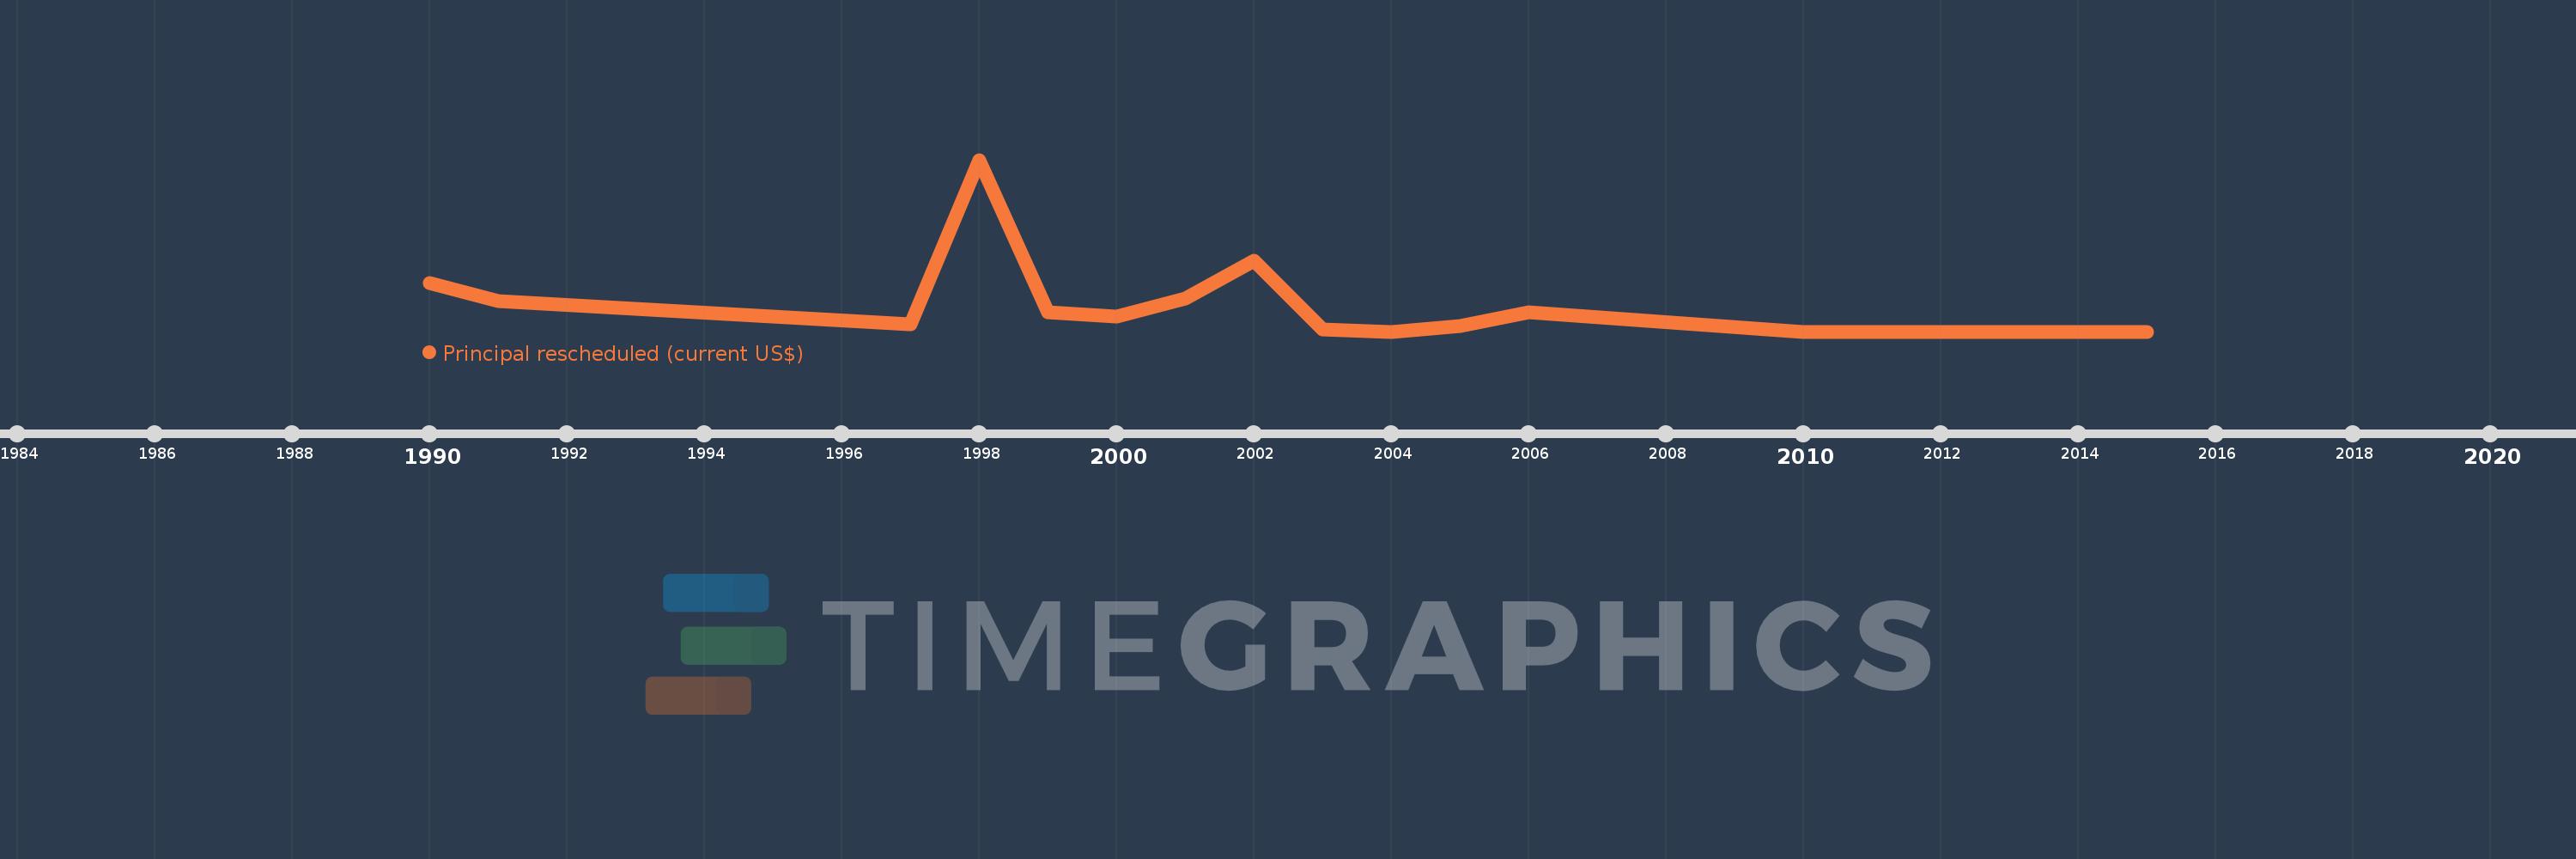
Principal rescheduled (current US$)
2015,2012,2011,2010,2006,2005,2004,2003,2002,2001,2000,1999,1998,1997,1991,1990
This statistics in other country:
Timeline:
This timeline shows a graph from 1990 to 2015 of Yemen, Rep.. No data until 1989. Number of actual observations by date: 16.
Source name:
World Development Indicators
Source organization:
World Bank, International Debt Statistics.
Categories, topics:
External Debt
Last updated:
apr 23, 2017
Indicators value changes by year
Maximum:
559.191 mln
jan 1, 1998
At the date of observation
Value
Absolute change
Change from previous value
jan 1, 1990
157.995 mln
+157.995 mln
0.0%
jan 1, 1991
97.948 mln
-60.047 mln
-38.01%
jan 1, 1997
24.022 mln
-73.926 mln
-75.47%
jan 1, 1998
559.191 mln
+535.169 mln
2.23K%
jan 1, 1999
63.132 mln
-496.059 mln
-88.71%
jan 1, 2000
50.038 mln
-13.094 mln
-20.74%
jan 1, 2001
107.475 mln
+57.437 mln
114.79%
jan 1, 2002
230.541 mln
+123.066 mln
114.51%
jan 1, 2003
7.0 mln
-223.541 mln
-96.96%
jan 1, 2004
0.0
-7.0 mln
-100.0%
jan 1, 2005
17.854 mln
+17.854 mln
%
jan 1, 2006
63.016 mln
+45.162 mln
252.95%
jan 1, 2010
0.0
-63.016 mln
-100.0%
Ranking of countries by current statistics by years


Comments: