29
/
en
AIzaSyAYiBZKx7MnpbEhh9jyipgxe19OcubqV5w
April 1, 2024
284346
Yemen, Rep.
YEM
true
2
1
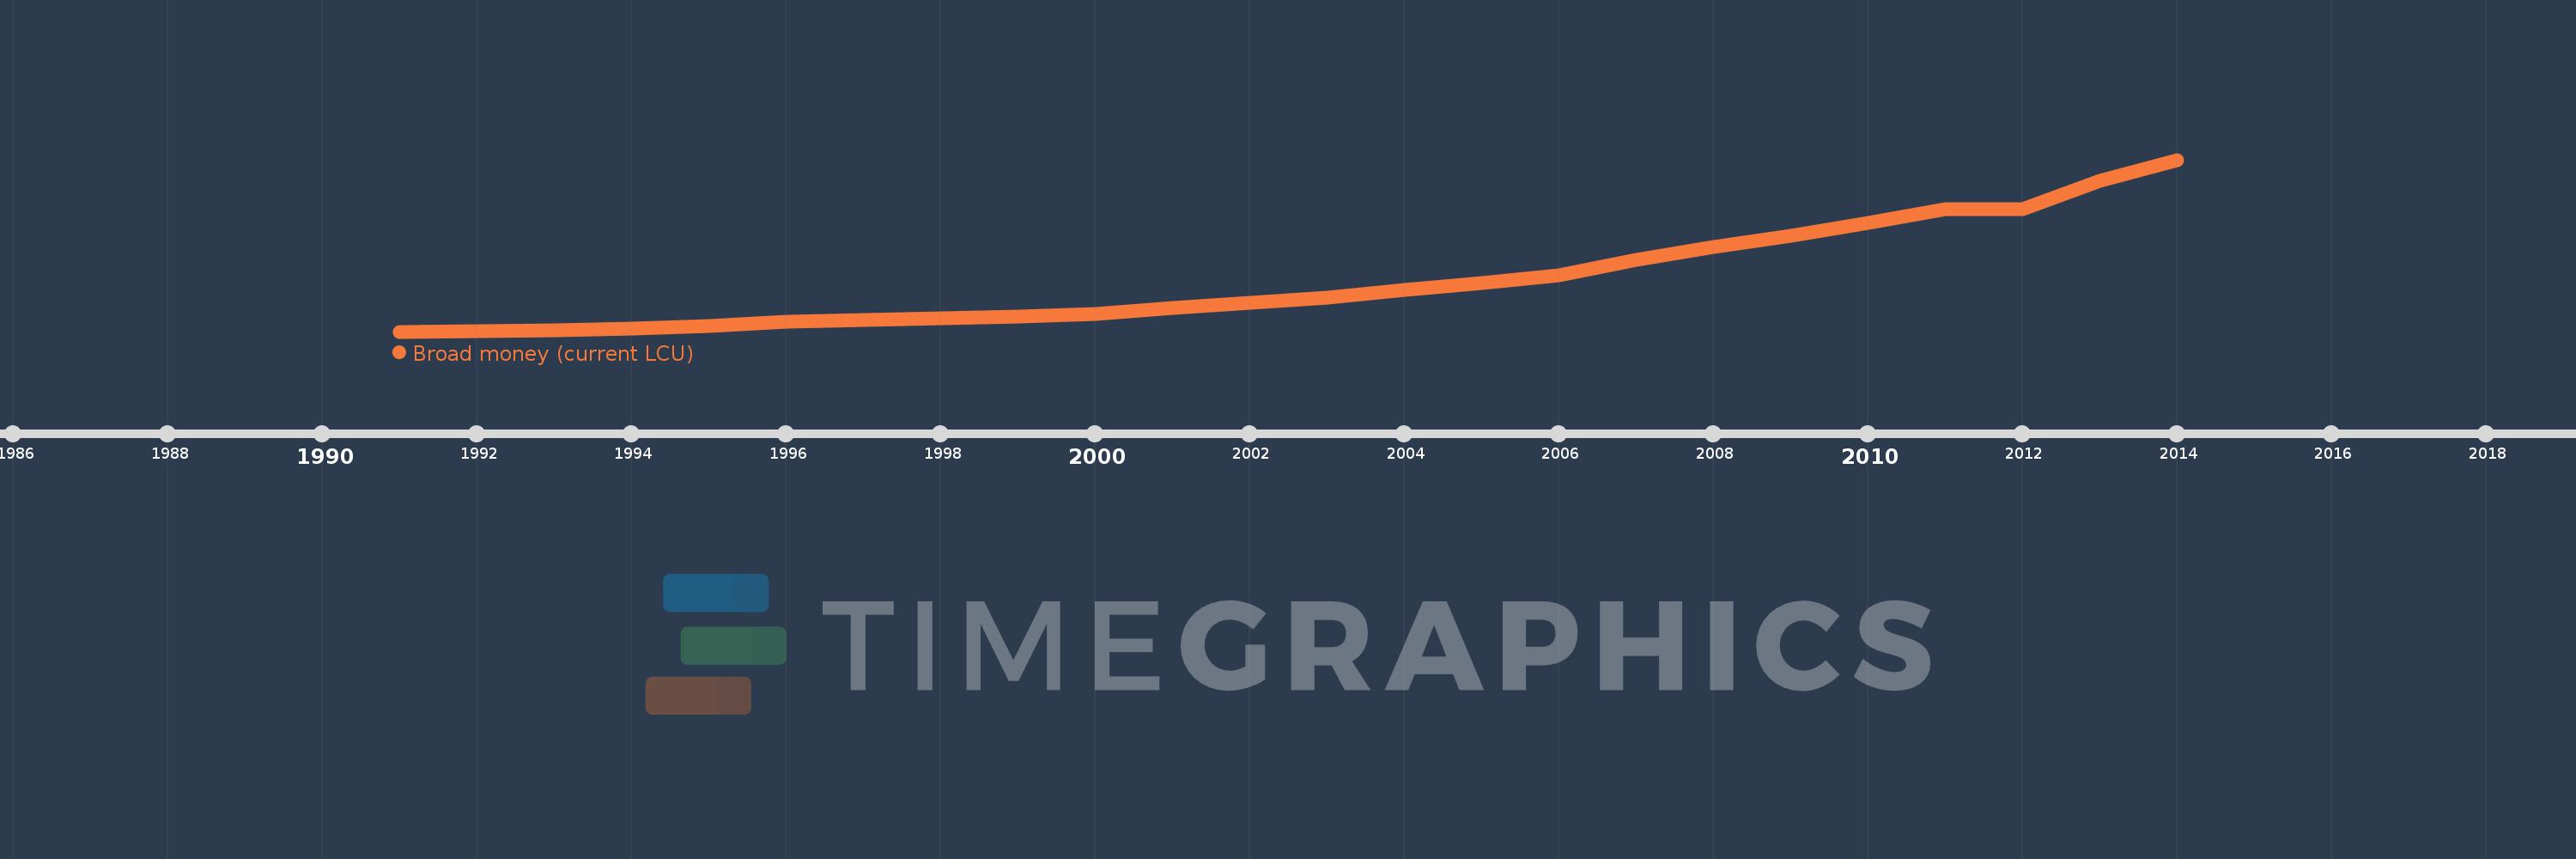
Broad money (current LCU)
2014,2013,2012,2011,2010,2009,2008,2007,2006,2005,2004,2003,2002,2001,2000,1999,1998,1997,1996,1995,1994,1993,1992,1991
This statistics in other country:
AfghanistanAlbaniaAlgeriaAngolaAntigua and BarbudaArgentinaArmeniaArubaAustraliaAzerbaijanBahamas, TheBahrainBangladeshBarbadosBelarusBelizeBeninBhutanBoliviaBosnia and HerzegovinaBotswanaBrazilBrunei DarussalamBulgariaBurkina FasoBurundiCabo VerdeCambodiaCameroonCanadaCentral African RepublicChadChileChinaColombiaComorosCongo, Dem. Rep.Congo, Rep.Costa RicaCote d'IvoireCroatiaCzech RepublicDenmarkDjiboutiDominicaDominican RepublicEcuadorEgypt, Arab Rep.El SalvadorEquatorial GuineaEritreaEstoniaEthiopiaEuro areaFijiGabonGambia, TheGeorgiaGhanaGrenadaGuatemalaGuineaGuinea-BissauGuyanaHaitiHondurasHong Kong SAR, ChinaHungaryIcelandIndiaIndonesiaIran, Islamic Rep.IraqIsraelJamaicaJapanJordanKazakhstanKenyaKorea, Rep.KuwaitKyrgyz RepublicLao PDRLatviaLebanonLesothoLiberiaLibyaLithuaniaMacao SAR, ChinaMacedonia, FYRMadagascarMalawiMalaysiaMaldivesMaliMauritaniaMauritiusMexicoMicronesia, Fed. Sts.MoldovaMongoliaMoroccoMozambiqueMyanmarNamibiaNepalNew ZealandNicaraguaNigerNigeriaNorwayOmanPakistanPanamaPapua New GuineaParaguayPeruPhilippinesPolandQatarRomaniaRussian FederationRwandaSamoaSao Tome and PrincipeSaudi ArabiaSenegalSerbiaSeychellesSierra LeoneSingaporeSlovak RepublicSolomon IslandsSouth AfricaSouth SudanSri LankaSt. Kitts and NevisSt. LuciaSt. Vincent and the GrenadinesSudanSurinameSwazilandSwedenSwitzerlandSyrian Arab RepublicTajikistanTanzaniaThailandTimor-LesteTogoTongaTrinidad and TobagoTunisiaTurkeyUgandaUkraineUnited Arab EmiratesUnited KingdomUnited StatesUruguayVanuatuVenezuela, RBVietnamWest Bank and GazaYemen, Rep.ZambiaZimbabwe Timeline:
This timeline shows a graph from 1991 to 2014 of Yemen, Rep.. No data until 1990. Number of actual observations by date: 24.
Source name:
World Development Indicators
Source organization:
International Monetary Fund, International Financial Statistics and data files.
Categories, topics:
Financial Sector
Last updated:
apr 23, 2017
Indicators value changes by year
Minimum:
69.703 bln
jan 1, 1991
Maximum:
3.017 trl
jan 1, 2014
At the date of observation
Value
Absolute change
Change from previous value
jan 1, 1991
69.703 bln
+69.703 bln
0.0%
jan 1, 1992
77.555 bln
+7.852 bln
11.27%
jan 1, 1993
93.726 bln
+16.171 bln
20.85%
jan 1, 1994
122.909 bln
+29.183 bln
31.14%
jan 1, 1995
162.829 bln
+39.92 bln
32.48%
jan 1, 1996
245.415 bln
+82.586 bln
50.72%
jan 1, 1997
265.184 bln
+19.769 bln
8.06%
jan 1, 1998
294.849 bln
+29.665 bln
11.19%
jan 1, 1999
329.658 bln
+34.809 bln
11.81%
jan 1, 2000
375.109 bln
+45.452 bln
13.79%
jan 1, 2001
469.833 bln
+94.724 bln
25.25%
jan 1, 2002
557.985 bln
+88.152 bln
18.76%
jan 1, 2003
655.631 bln
+97.646 bln
17.5%
jan 1, 2004
784.463 bln
+128.832 bln
19.65%
jan 1, 2005
898.781 bln
+114.318 bln
14.57%
jan 1, 2006
1.028 trl
+129.419 bln
14.4%
jan 1, 2007
1.297 trl
+268.336 bln
26.1%
jan 1, 2008
1.517 trl
+220.405 bln
17.0%
jan 1, 2009
1.718 trl
+200.601 bln
13.22%
jan 1, 2010
1.938 trl
+219.999 bln
12.81%
jan 1, 2011
2.166 trl
+228.115 bln
11.77%
jan 1, 2012
2.174 trl
+8.738 bln
0.4%
jan 1, 2013
2.653 trl
+478.525 bln
22.01%
jan 1, 2014
3.017 trl
+364.272 bln
13.73%
Ranking of countries by current statistics by years


Comments: