29
/
en
AIzaSyAYiBZKx7MnpbEhh9jyipgxe19OcubqV5w
April 1, 2024
282284
Vietnam
VNM
true
2
1
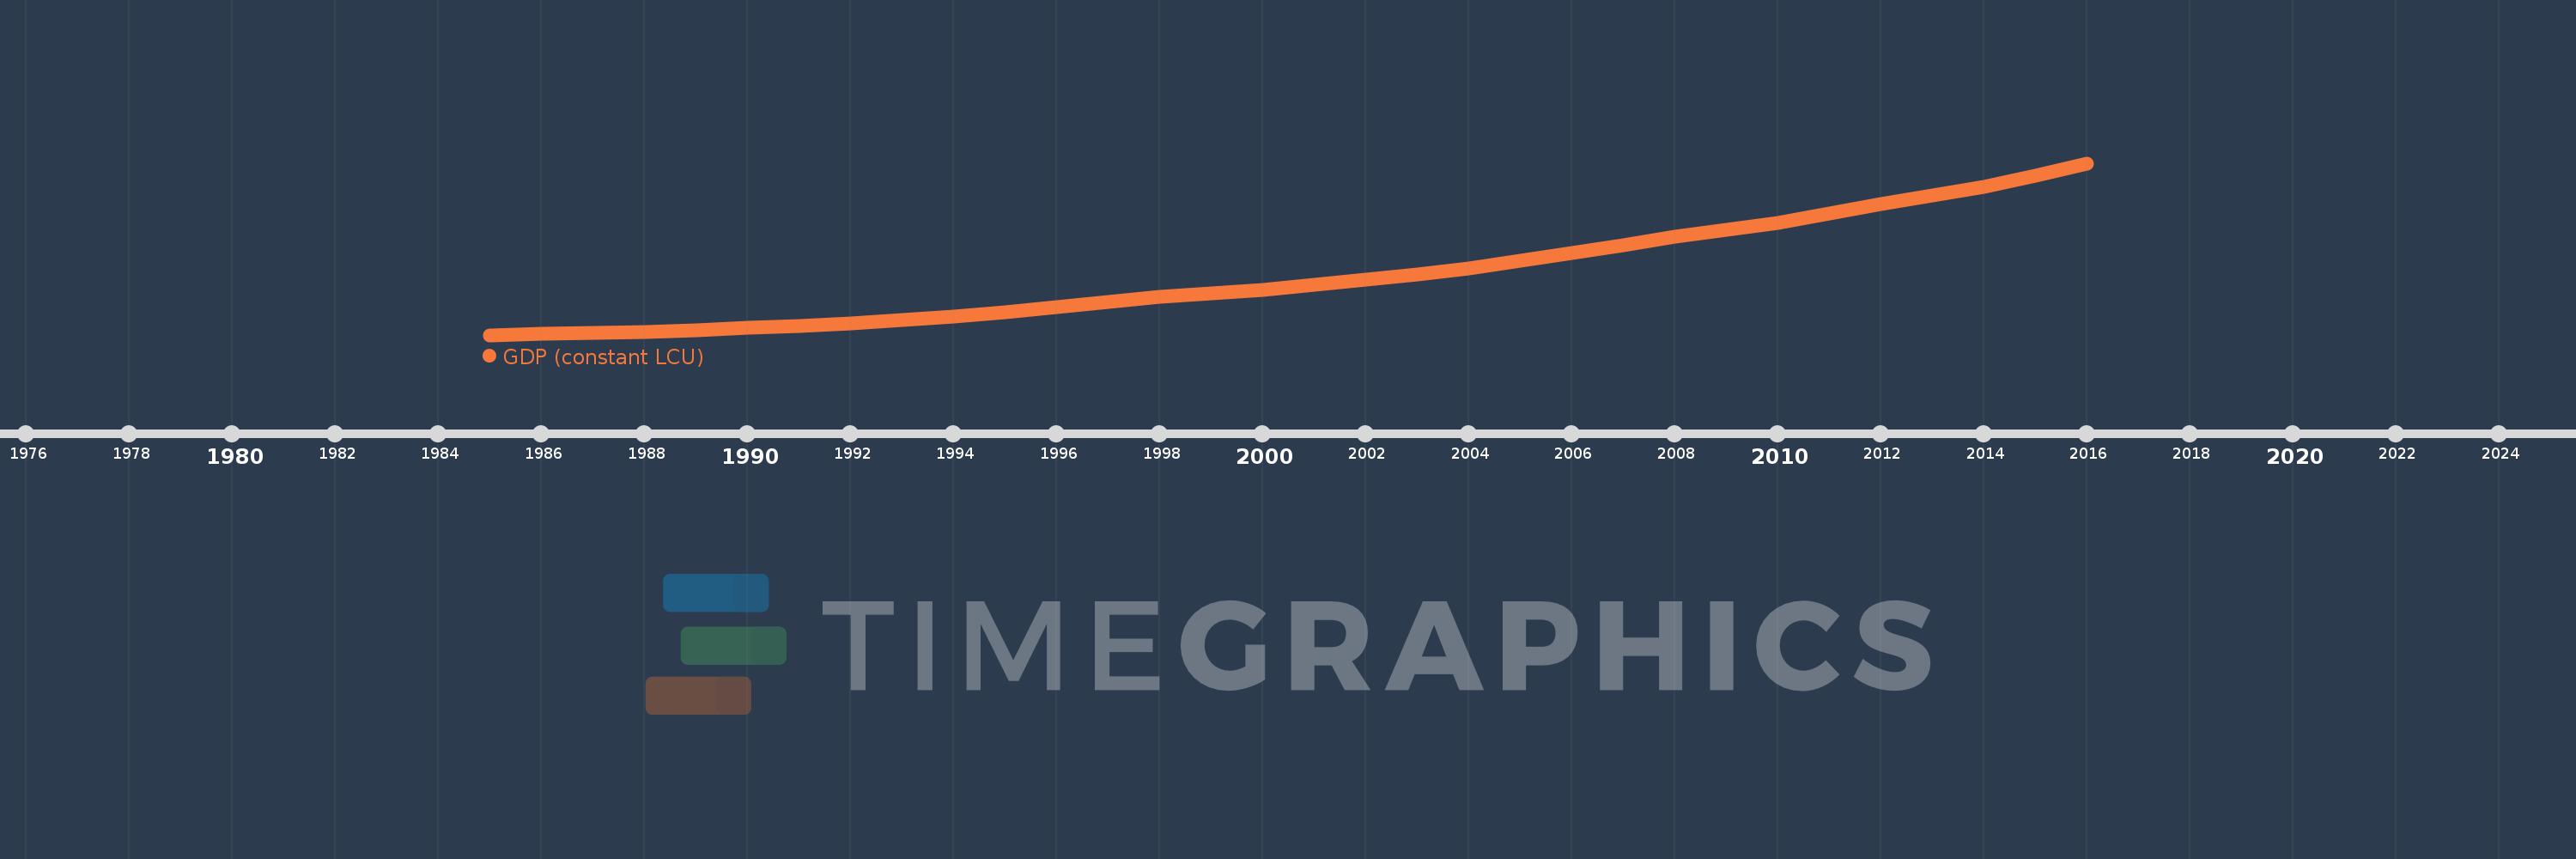
GDP (constant LCU)
2016,2015,2014,2013,2012,2011,2010,2009,2008,2007,2006,2005,2004,2003,2002,2001,2000,1999,1998,1997,1996,1995,1994,1993,1992,1991,1990,1989,1988,1987,1986,1985
This statistics in other country:
AfghanistanAlbaniaAlgeriaAndorraAngolaAntigua and BarbudaArgentinaArmeniaArubaAustraliaAustriaAzerbaijanBahamas, TheBahrainBangladeshBarbadosBelarusBelgiumBelizeBeninBermudaBhutanBoliviaBosnia and HerzegovinaBotswanaBrazilBrunei DarussalamBulgariaBurkina FasoBurundiCabo VerdeCambodiaCameroonCanadaCayman IslandsCentral African RepublicChadChannel IslandsChileChinaColombiaComorosCongo, Dem. Rep.Congo, Rep.Costa RicaCote d'IvoireCroatiaCubaCyprusCzech RepublicDenmarkDjiboutiDominicaDominican RepublicEcuadorEgypt, Arab Rep.El SalvadorEquatorial GuineaEritreaEstoniaEthiopiaFijiFinlandFranceFrench PolynesiaGabonGambia, TheGeorgiaGermanyGhanaGreeceGreenlandGrenadaGuatemalaGuineaGuinea-BissauGuyanaHaitiHondurasHong Kong SAR, ChinaHungaryIcelandIndiaIndonesiaIran, Islamic Rep.IraqIrelandIsle of ManIsraelItalyJamaicaJapanJordanKazakhstanKenyaKiribatiKorea, Rep.KosovoKuwaitKyrgyz RepublicLao PDRLatviaLebanonLesothoLiberiaLibyaLiechtensteinLithuaniaLuxembourgMacao SAR, ChinaMacedonia, FYRMadagascarMalawiMalaysiaMaldivesMaliMaltaMarshall IslandsMauritaniaMauritiusMexicoMicronesia, Fed. Sts.MoldovaMonacoMongoliaMontenegroMoroccoMozambiqueMyanmarNamibiaNauruNepalNetherlandsNew CaledoniaNew ZealandNicaraguaNigerNigeriaNorwayOmanPakistanPalauPanamaPapua New GuineaParaguayPeruPhilippinesPolandPortugalPuerto RicoQatarRomaniaRussian FederationRwandaSamoaSan MarinoSao Tome and PrincipeSaudi ArabiaSenegalSerbiaSeychellesSierra LeoneSingaporeSlovak RepublicSloveniaSolomon IslandsSomaliaSouth AfricaSouth SudanSpainSri LankaSt. Kitts and NevisSt. LuciaSt. Vincent and the GrenadinesSudanSurinameSwazilandSwedenSwitzerlandSyrian Arab RepublicTajikistanTanzaniaThailandTimor-LesteTogoTongaTrinidad and TobagoTunisiaTurkeyTurkmenistanTuvaluUgandaUkraineUnited Arab EmiratesUnited KingdomUnited StatesUruguayUzbekistanVanuatuVenezuela, RBVietnamVirgin Islands (U.S.)West Bank and GazaYemen, Rep.ZambiaZimbabwe Timeline:
This timeline shows a graph from 1985 to 2016 of Vietnam. No data until 1984. Number of actual observations by date: 32.
Source name:
World Development Indicators
Source organization:
World Bank national accounts data, and OECD National Accounts data files.
Categories, topics:
Economy & Growth
Last updated:
apr 23, 2017
Indicators value changes by year
Minimum:
418.167 trl
jan 1, 1985
Maximum:
2875.856 trl
jan 1, 2016
At the date of observation
Value
Absolute change
Change from previous value
jan 1, 1985
418.167 trl
+418.167 trl
0.0%
jan 1, 1986
434.082 trl
+15.915 trl
3.81%
jan 1, 1987
446.19 trl
+12.108 trl
2.79%
jan 1, 1988
462.179 trl
+15.989 trl
3.58%
jan 1, 1989
485.912 trl
+23.733 trl
5.14%
jan 1, 1990
521.697 trl
+35.785 trl
7.36%
jan 1, 1991
548.308 trl
+26.611 trl
5.1%
jan 1, 1992
580.992 trl
+32.684 trl
5.96%
jan 1, 1993
631.225 trl
+50.233 trl
8.65%
jan 1, 1994
682.182 trl
+50.957 trl
8.07%
jan 1, 1995
742.48 trl
+60.298 trl
8.84%
jan 1, 1996
813.316 trl
+70.836 trl
9.54%
jan 1, 1997
889.28 trl
+75.964 trl
9.34%
jan 1, 1998
961.775 trl
+72.495 trl
8.15%
jan 1, 1999
1017.216 trl
+55.441 trl
5.76%
jan 1, 2000
1065.774 trl
+48.558 trl
4.77%
jan 1, 2001
1138.111 trl
+72.337 trl
6.79%
jan 1, 2002
1208.593 trl
+70.482 trl
6.19%
jan 1, 2003
1284.986 trl
+76.393 trl
6.32%
jan 1, 2004
1373.638 trl
+88.652 trl
6.9%
jan 1, 2005
1477.161 trl
+103.523 trl
7.54%
jan 1, 2006
1588.646 trl
+111.485 trl
7.55%
jan 1, 2007
1699.501 trl
+110.855 trl
6.98%
jan 1, 2008
1820.667 trl
+121.166 trl
7.13%
jan 1, 2009
1923.749 trl
+103.082 trl
5.66%
jan 1, 2010
2027.591 trl
+103.842 trl
5.4%
jan 1, 2011
2157.828 trl
+130.237 trl
6.42%
jan 1, 2012
2292.483 trl
+134.655 trl
6.24%
jan 1, 2013
2412.778 trl
+120.295 trl
5.25%
jan 1, 2014
2543.596 trl
+130.818 trl
5.42%
jan 1, 2015
2695.796 trl
+152.2 trl
5.98%
jan 1, 2016
2875.856 trl
+180.06 trl
6.68%
Ranking of countries by current statistics by years


Comments: