29
/
en
AIzaSyAYiBZKx7MnpbEhh9jyipgxe19OcubqV5w
April 1, 2024
27930
East Asia & Pacific (excluding high income)
EAP
false
2
1
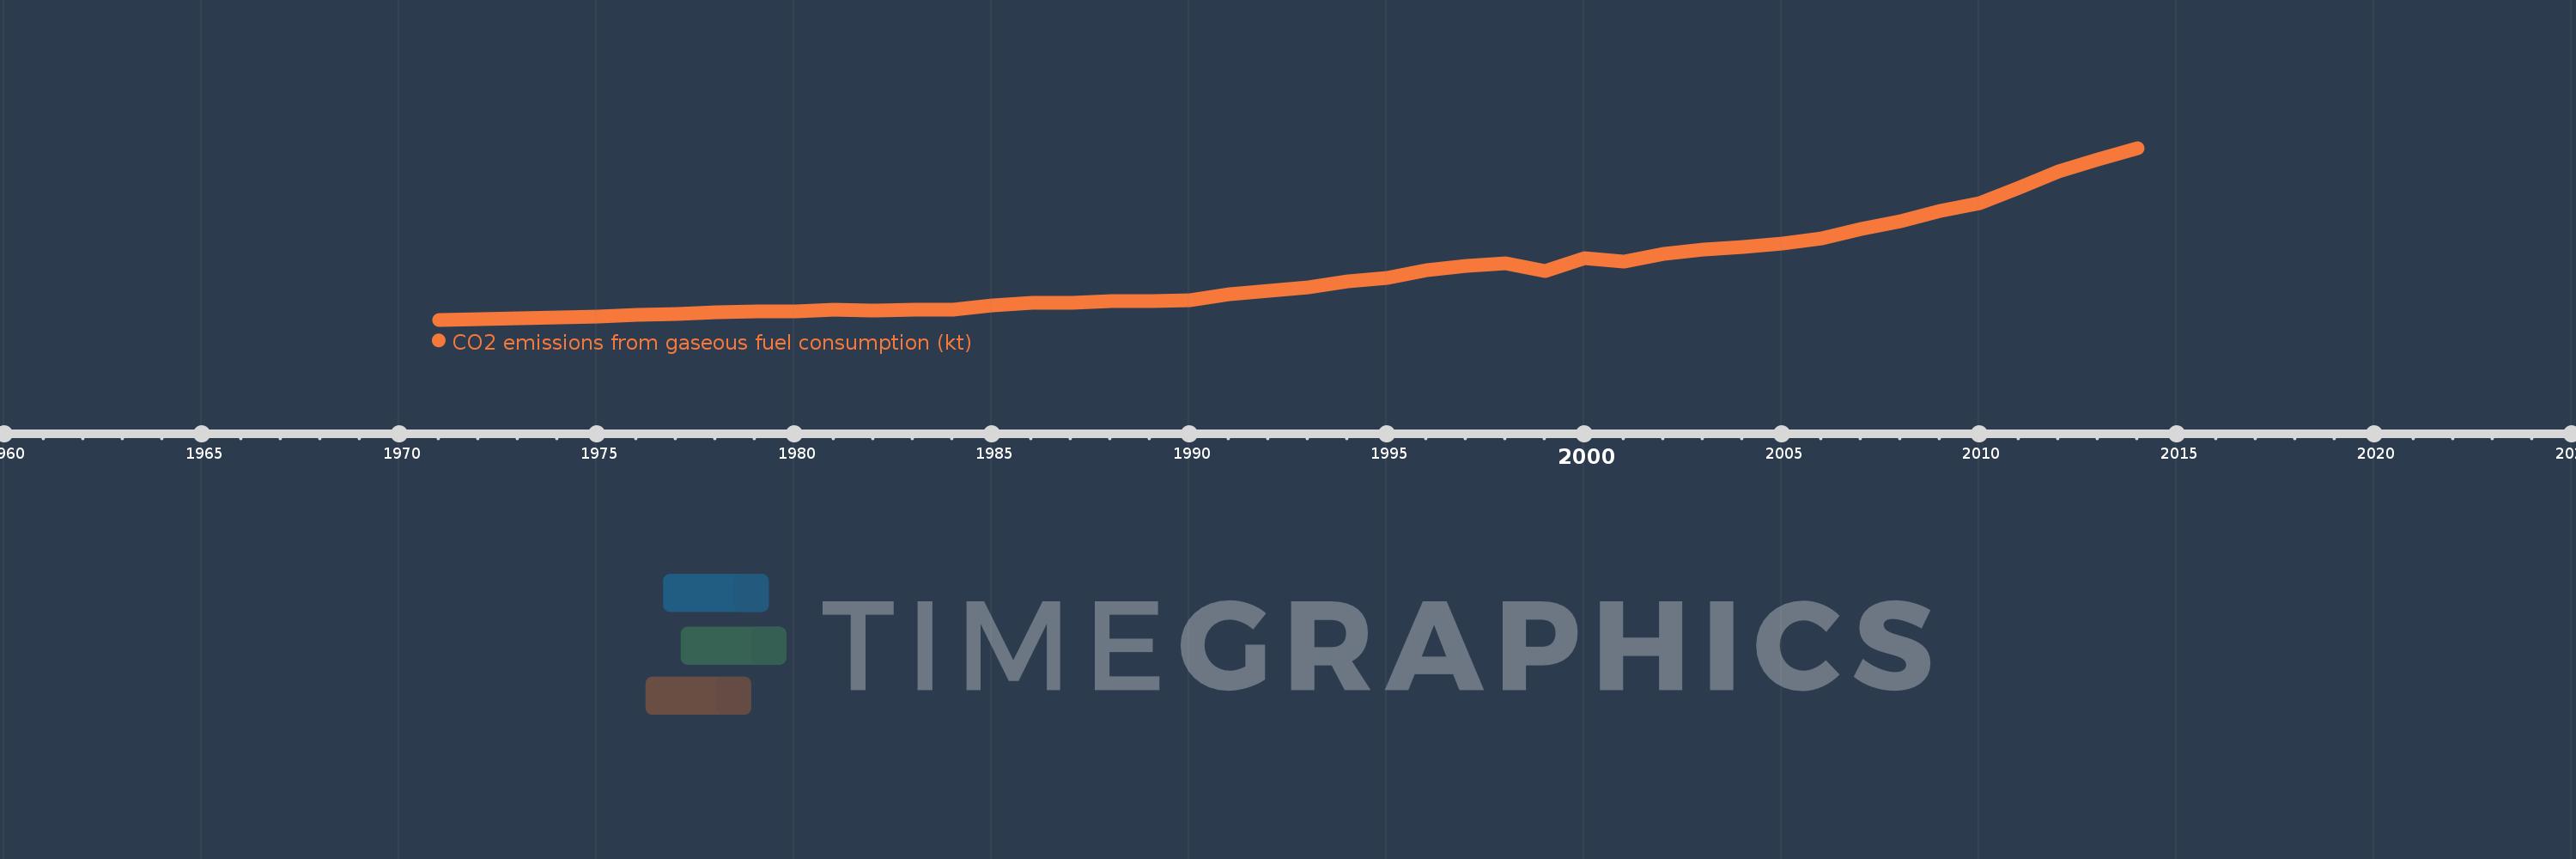
CO2 emissions from gaseous fuel consumption (kt)
2014,2013,2012,2011,2010,2009,2008,2007,2006,2005,2004,2003,2002,2001,2000,1999,1998,1997,1996,1995,1994,1993,1992,1991,1990,1989,1988,1987,1986,1985,1984,1983,1982,1981,1980,1979,1978,1977,1976,1975,1974,1973,1972,1971
This statistics in other country:
AfghanistanAlbaniaAlgeriaAndorraAngolaAntigua and BarbudaArab WorldArgentinaArmeniaArubaAustraliaAustriaAzerbaijanBahamas, TheBahrainBangladeshBarbadosBelarusBelgiumBelizeBeninBermudaBhutanBoliviaBosnia and HerzegovinaBotswanaBrazilBritish Virgin IslandsBrunei DarussalamBulgariaBurkina FasoBurundiCabo VerdeCambodiaCameroonCanadaCayman IslandsCentral African RepublicCentral Europe and the BalticsChadChileChinaColombiaComorosCongo, Dem. Rep.Congo, Rep.Costa RicaCote d'IvoireCroatiaCubaCuracaoCyprusCzech RepublicDenmarkDjiboutiDominicaDominican RepublicEarly-demographic dividendEast Asia & PacificEast Asia & Pacific (excluding high income)East Asia & Pacific (IDA & IBRD countries)EcuadorEgypt, Arab Rep.El SalvadorEquatorial GuineaEritreaEstoniaEthiopiaEuro areaEurope & Central AsiaEurope & Central Asia (excluding high income)Europe & Central Asia (IDA & IBRD countries)European UnionFaroe IslandsFijiFinlandFragile and conflict affected situationsFranceFrench PolynesiaGabonGambia, TheGeorgiaGermanyGhanaGibraltarGreeceGreenlandGrenadaGuatemalaGuineaGuinea-BissauGuyanaHaitiHigh incomeHondurasHong Kong SAR, ChinaHungaryIBRD onlyIcelandIDA & IBRD totalIDA blendIDA totalIndiaIndonesiaIran, Islamic Rep.IraqIrelandIsraelItalyJamaicaJapanJordanKazakhstanKenyaKiribatiKorea, Dem. People’s Rep.Korea, Rep.KuwaitKyrgyz RepublicLao PDRLate-demographic dividendLatin America & Caribbean Latin America & Caribbean (excluding high income)Latin America & the Caribbean (IDA & IBRD countries)LatviaLebanonLesothoLiberiaLibyaLiechtensteinLithuaniaLow & middle incomeLower middle incomeLuxembourgMacao SAR, ChinaMacedonia, FYRMadagascarMalawiMalaysiaMaldivesMaliMaltaMarshall IslandsMauritaniaMauritiusMexicoMicronesia, Fed. Sts.Middle East & North AfricaMiddle East & North Africa (excluding high income)Middle East & North Africa (IDA & IBRD countries)Middle incomeMoldovaMongoliaMontenegroMoroccoMozambiqueMyanmarNamibiaNauruNepalNetherlandsNew CaledoniaNew ZealandNicaraguaNigerNigeriaNorth AmericaNorwayOECD membersOmanPakistanPalauPanamaPapua New GuineaParaguayPeruPhilippinesPolandPortugalPost-demographic dividendPre-demographic dividendQatarRomaniaRussian FederationRwandaSamoaSao Tome and PrincipeSaudi ArabiaSenegalSerbiaSeychellesSierra LeoneSingaporeSint Maarten (Dutch part)Slovak RepublicSloveniaSolomon IslandsSomaliaSouth AfricaSouth AsiaSouth Asia (IDA & IBRD)South SudanSpainSri LankaSt. Kitts and NevisSt. LuciaSt. Vincent and the GrenadinesSub-Saharan Africa Sub-Saharan Africa (excluding high income)Sub-Saharan Africa (IDA & IBRD countries)SudanSurinameSwazilandSwedenSwitzerlandSyrian Arab RepublicTajikistanTanzaniaThailandTimor-LesteTogoTongaTrinidad and TobagoTunisiaTurkeyTurkmenistanTurks and Caicos IslandsUgandaUkraineUnited Arab EmiratesUnited KingdomUnited StatesUpper middle incomeUruguayUzbekistanVanuatuVenezuela, RBVietnamWest Bank and GazaWorldYemen, Rep.ZambiaZimbabwe Timeline:
This timeline shows a graph from 1971 to 2014 of East Asia & Pacific (excluding high income). No data until 1970. Number of actual observations by date: 44.
Source name:
World Development Indicators
Source organization:
Carbon Dioxide Information Analysis Center, Environmental Sciences Division, Oak Ridge National Laboratory, Tennessee, United States.
Categories, topics:
Climate Change, Environment
Last updated:
apr 23, 2017
Indicators value changes by year
Minimum:
8.168K
jan 1, 1971
Maximum:
581.367K
jan 1, 2014
At the date of observation
Value
Absolute change
Change from previous value
jan 1, 1971
8.168K
+8.168K
0.0%
jan 1, 1972
10.446K
+2.279K
27.9%
jan 1, 1973
12.011K
+1.564K
14.97%
jan 1, 1974
15.429K
+3.418K
28.46%
jan 1, 1975
18.874K
+3.445K
22.33%
jan 1, 1976
23.612K
+4.738K
25.1%
jan 1, 1977
26.864K
+3.253K
13.78%
jan 1, 1978
31.749K
+4.885K
18.18%
jan 1, 1979
35.701K
+3.952K
12.45%
jan 1, 1980
36.758K
+1.057K
2.96%
jan 1, 1981
41.335K
+4.576K
12.45%
jan 1, 1982
39.77K
-1.564K
-3.78%
jan 1, 1983
42.49K
+2.72K
6.84%
jan 1, 1984
42.368K
-122.267
-0.29%
jan 1, 1985
56.773K
+14.405K
34.0%
jan 1, 1986
63.527K
+6.754K
11.9%
jan 1, 1987
64.027K
+500.185
0.79%
jan 1, 1988
70.478K
+6.451K
10.07%
jan 1, 1989
70.378K
-100.037
-0.14%
jan 1, 1990
73.898K
+3.52K
5.0%
jan 1, 1991
94.113K
+20.215K
27.36%
jan 1, 1992
104.163K
+10.05K
10.68%
jan 1, 1993
116.293K
+12.13K
11.65%
jan 1, 1994
135.544K
+19.251K
16.55%
jan 1, 1995
147.093K
+11.549K
8.52%
jan 1, 1996
173.137K
+26.044K
17.71%
jan 1, 1997
187.066K
+13.929K
8.05%
jan 1, 1998
195.228K
+8.162K
4.36%
jan 1, 1999
169.628K
-25.6K
-13.11%
jan 1, 2000
213.994K
+44.366K
26.16%
jan 1, 2001
200.98K
-13.014K
-6.08%
jan 1, 2002
229.255K
+28.275K
14.07%
jan 1, 2003
241.904K
+12.649K
5.52%
jan 1, 2004
249.771K
+7.867K
3.25%
jan 1, 2005
263.423K
+13.652K
5.47%
jan 1, 2006
280.939K
+17.516K
6.65%
jan 1, 2007
310.679K
+29.74K
10.59%
jan 1, 2008
338.12K
+27.441K
8.83%
jan 1, 2009
370.87K
+32.751K
9.69%
jan 1, 2010
397.437K
+26.567K
7.16%
jan 1, 2011
447.785K
+50.347K
12.67%
jan 1, 2012
502.659K
+54.875K
12.25%
jan 1, 2013
543.299K
+40.64K
8.08%
jan 1, 2014
581.367K
+38.068K
7.01%
Ranking of countries by current statistics by years


Comments: