29
/
en
AIzaSyAYiBZKx7MnpbEhh9jyipgxe19OcubqV5w
April 1, 2024
279202
Uzbekistan
UZB
true
2
1
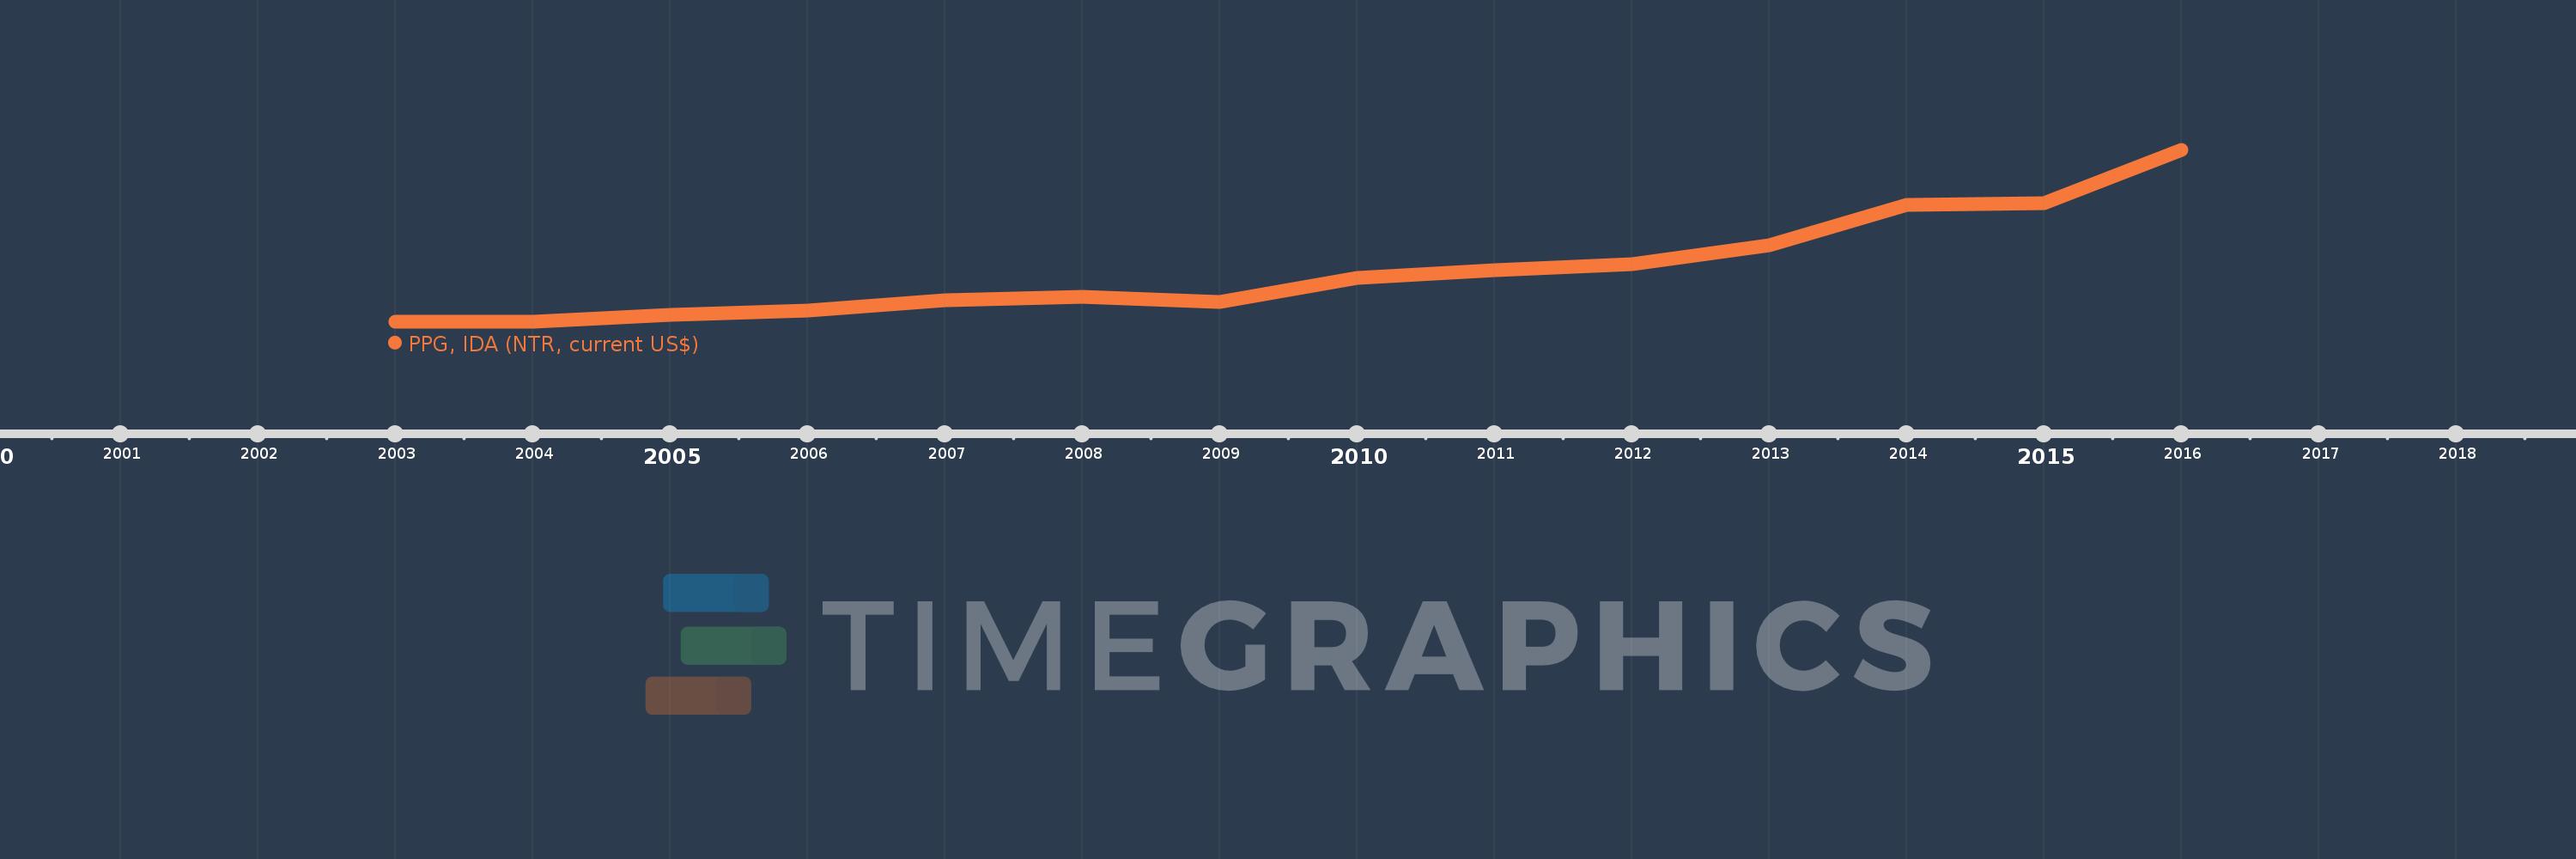
PPG, IDA (NTR, current US$)
2016,2015,2014,2013,2012,2011,2010,2009,2008,2007,2006,2005,2004,2003
This statistics in other country:
Timeline:
This timeline shows a graph from 2003 to 2016 of Uzbekistan. No data until 2002. Number of actual observations by date: 14.
Source name:
World Development Indicators
Source organization:
World Bank, International Debt Statistics.
Categories, topics:
External Debt
Last updated:
apr 23, 2017
Indicators value changes by year
Maximum:
105.13 mln
jan 1, 2016
At the date of observation
Value
Absolute change
Change from previous value
jan 1, 2004
210.0K
+210.0K
%
jan 1, 2005
4.303 mln
+4.093 mln
1.95K%
jan 1, 2006
6.773 mln
+2.47 mln
57.4%
jan 1, 2007
13.058 mln
+6.285 mln
92.79%
jan 1, 2008
15.417 mln
+2.359 mln
18.07%
jan 1, 2009
12.265 mln
-3.152 mln
-20.44%
jan 1, 2010
27.149 mln
+14.884 mln
121.35%
jan 1, 2011
31.435 mln
+4.286 mln
15.79%
jan 1, 2012
35.362 mln
+3.927 mln
12.49%
jan 1, 2013
47.049 mln
+11.687 mln
33.05%
jan 1, 2014
71.44 mln
+24.391 mln
51.84%
jan 1, 2015
72.805 mln
+1.365 mln
1.91%
jan 1, 2016
105.13 mln
+32.325 mln
44.4%
Ranking of countries by current statistics by years


Comments: