29
/
en
AIzaSyAYiBZKx7MnpbEhh9jyipgxe19OcubqV5w
April 1, 2024
278976
Uzbekistan
UZB
true
2
1
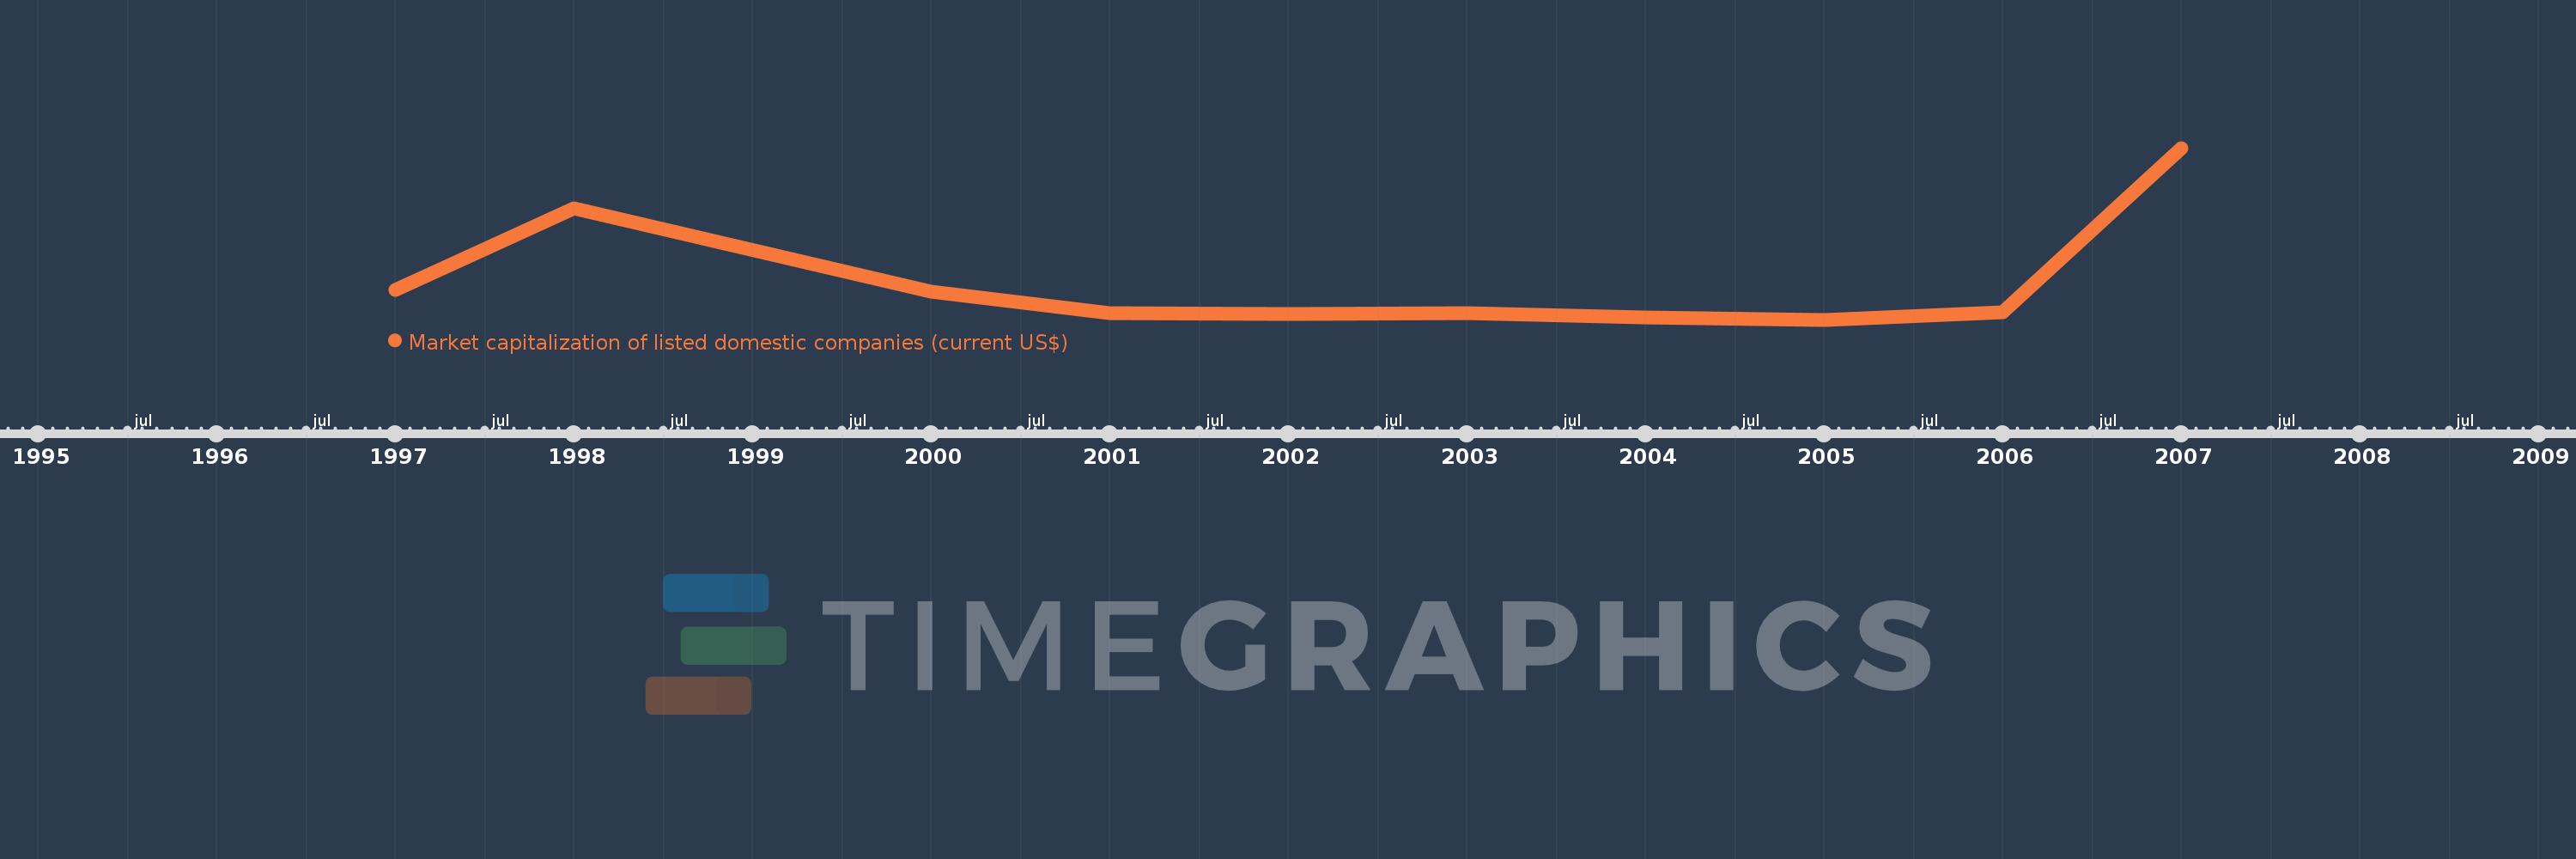
Market capitalization of listed domestic companies (current US$)
2007,2006,2005,2004,2003,2002,2001,2000,1998,1997
This statistics in other country:
Timeline:
This timeline shows a graph from 1997 to 2007 of Uzbekistan. No data until 1996. Number of actual observations by date: 10.
Source name:
World Development Indicators
Source organization:
World Federation of Exchanges database.
Categories, topics:
Financial Sector
Last updated:
apr 23, 2017
Indicators value changes by year
Minimum:
4.3 mln
jan 1, 2005
Maximum:
715.294 mln
jan 1, 2007
At the date of observation
Value
Absolute change
Change from previous value
jan 1, 1997
128.0 mln
+128.0 mln
0.0%
jan 1, 1998
465.0 mln
+337.0 mln
263.28%
jan 1, 2000
119.0 mln
-346.0 mln
-74.41%
jan 1, 2001
31.91 mln
-87.09 mln
-73.18%
jan 1, 2002
27.86 mln
-4.05 mln
-12.69%
jan 1, 2003
31.215 mln
+3.355 mln
12.04%
jan 1, 2004
14.048 mln
-17.167 mln
-55.0%
jan 1, 2005
4.3 mln
-9.748 mln
-69.39%
jan 1, 2006
36.886 mln
+32.586 mln
757.82%
jan 1, 2007
715.294 mln
+678.407 mln
1.84K%
Ranking of countries by current statistics by years


Comments: