29
/
en
AIzaSyAYiBZKx7MnpbEhh9jyipgxe19OcubqV5w
April 1, 2024
278149
Uruguay
URY
true
2
1
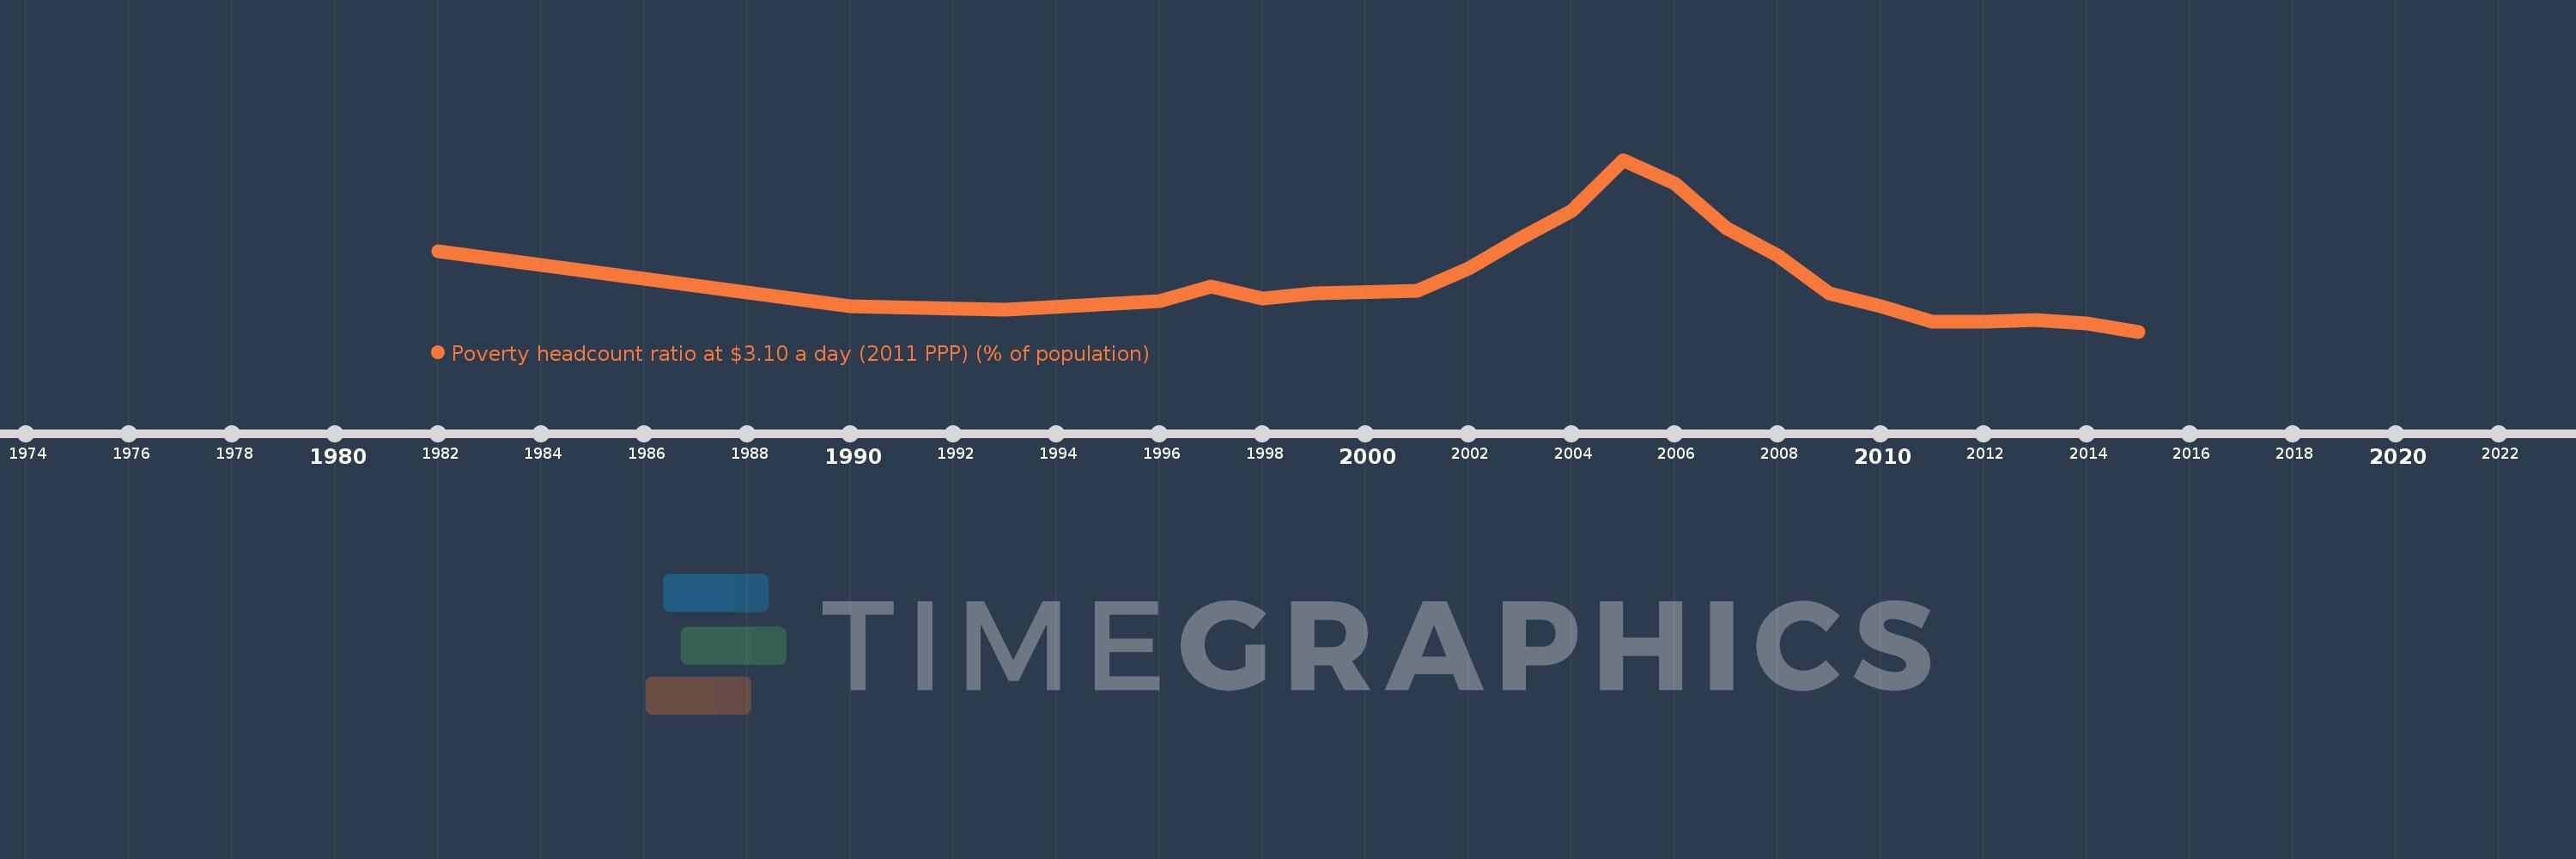
Poverty headcount ratio at $3.10 a day (2011 PPP) (% of population)
2015,2014,2013,2012,2011,2010,2009,2008,2007,2006,2005,2004,2003,2002,2001,1999,1998,1997,1996,1993,1990,1982
This statistics in other country:
Timeline:
This timeline shows a graph from 1982 to 2015 of Uruguay. No data until 1981. Number of actual observations by date: 22.
Source name:
World Development Indicators
Source organization:
World Bank, Development Research Group. Data are based on primary household survey data obtained from government statistical agencies and World Bank country departments. Data for high-income economies are from the Luxembourg Income Study database. For more information and methodology, please see PovcalNet (http://iresearch.worldbank.org/PovcalNet/index.htm).
Categories, topics:
Poverty
Last updated:
apr 23, 2017
Indicators value changes by year
At the date of observation
Value
Absolute change
Change from previous value
jan 1, 1982
3.92
+3.92
0.0%
jan 1, 1990
2.11
-1.81
-46.17%
jan 1, 1993
2.02
-0.09
-4.27%
jan 1, 1996
2.28
+0.26
12.87%
jan 1, 1997
2.76
+0.48
21.05%
jan 1, 1998
2.37
-0.39
-14.13%
jan 1, 1999
2.53
+0.16
6.75%
jan 1, 2001
2.63
+0.1
3.95%
jan 1, 2002
3.35
+0.72
27.38%
jan 1, 2003
4.32
+0.97
28.96%
jan 1, 2004
5.22
+0.9
20.83%
jan 1, 2005
6.88
+1.66
31.8%
jan 1, 2006
6.11
-0.77
-11.19%
jan 1, 2007
4.67
-1.44
-23.57%
jan 1, 2008
3.78
-0.89
-19.06%
jan 1, 2009
2.55
-1.23
-32.54%
jan 1, 2010
2.11
-0.44
-17.25%
jan 1, 2011
1.61
-0.5
-23.7%
jan 1, 2013
1.67
+0.06
3.73%
jan 1, 2014
1.56
-0.11
-6.59%
jan 1, 2015
1.3
-0.26
-16.67%
Ranking of countries by current statistics by years


Comments: