29
/
en
AIzaSyAYiBZKx7MnpbEhh9jyipgxe19OcubqV5w
April 1, 2024
276934
United States
USA
true
2
1
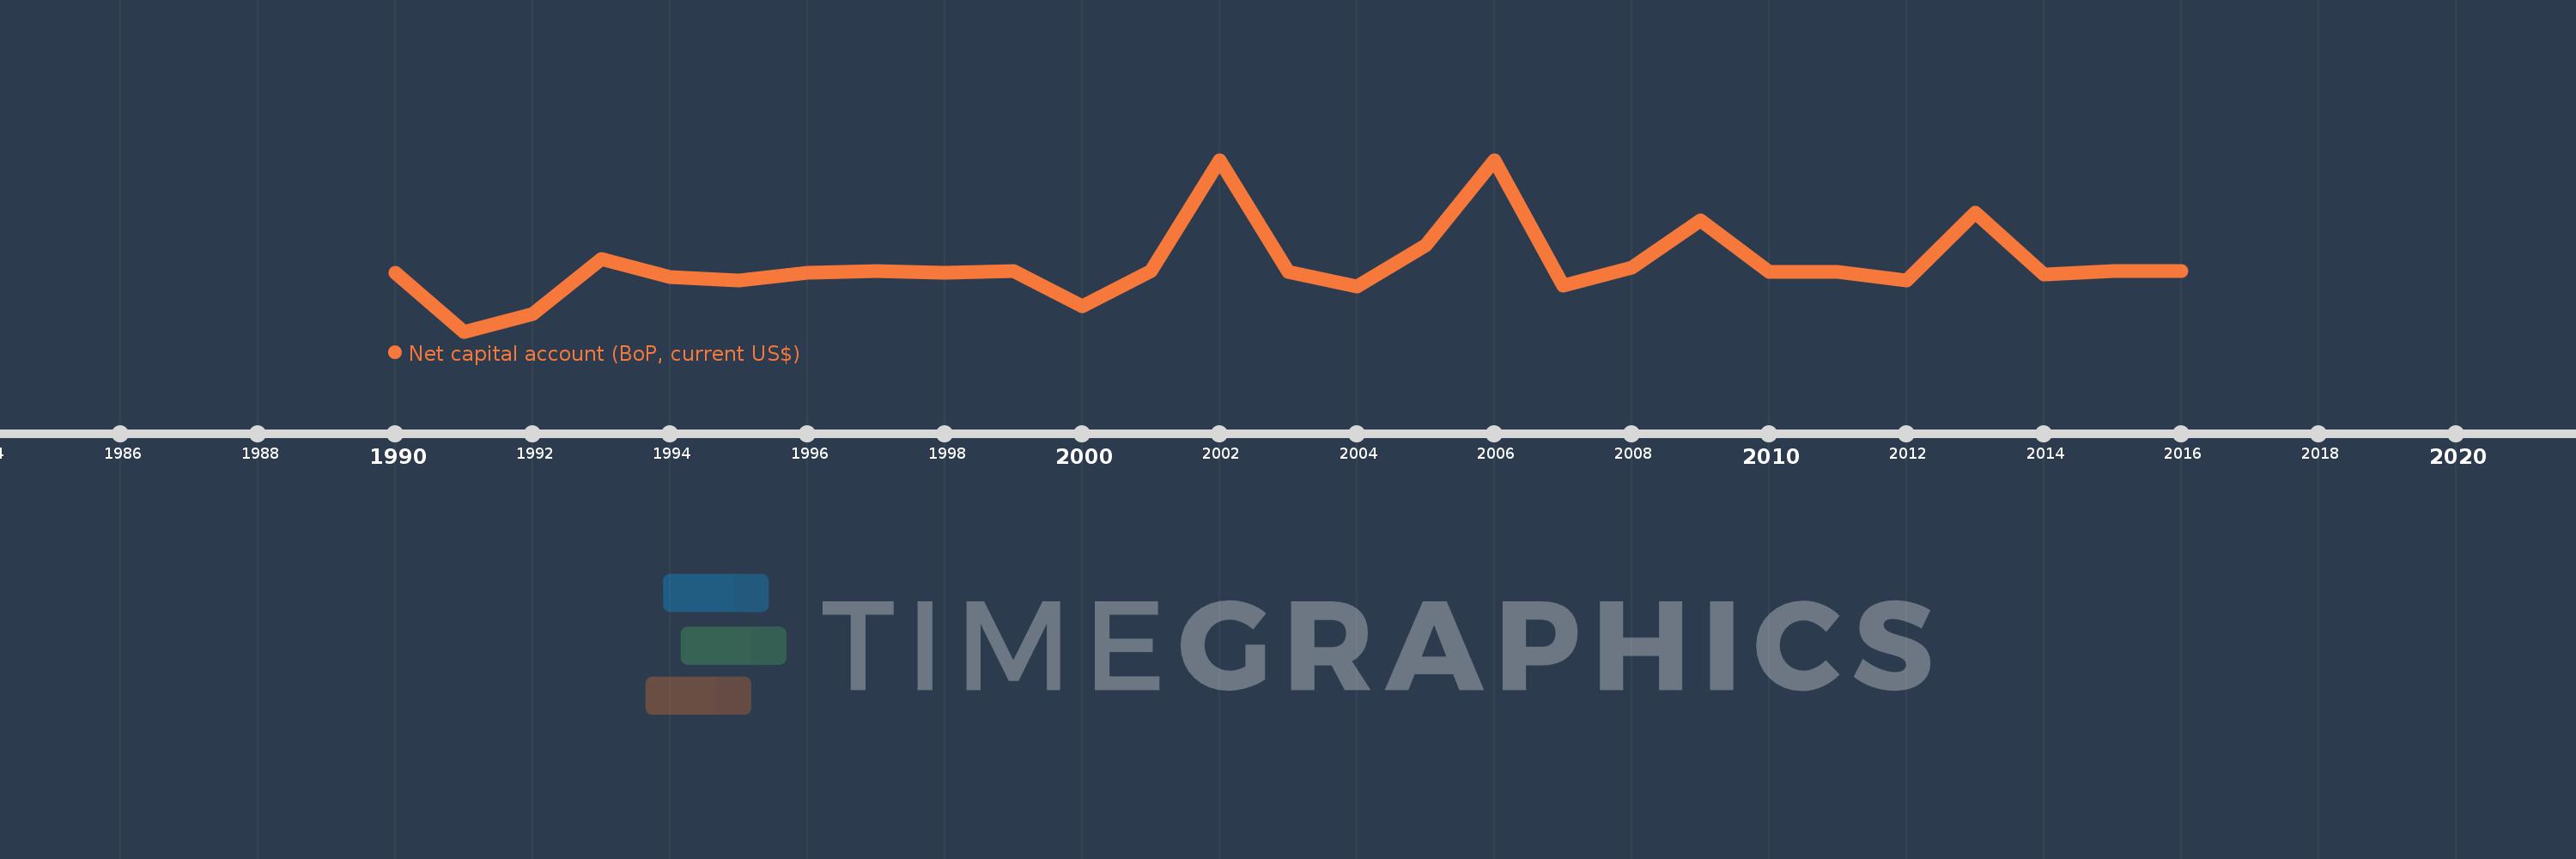
Net capital account (BoP, current US$)
2016,2015,2014,2013,2012,2011,2010,2009,2008,2007,2006,2005,2004,2003,2002,2001,2000,1999,1998,1997,1996,1995,1994,1993,1992,1991,1990
This statistics in other country:
AfghanistanAlbaniaAlgeriaAngolaAntigua and BarbudaArgentinaArmeniaArubaAustraliaAustriaAzerbaijanBahrainBangladeshBarbadosBelarusBelgiumBelizeBeninBhutanBoliviaBosnia and HerzegovinaBotswanaBrazilBrunei DarussalamBulgariaBurkina FasoBurundiCabo VerdeCambodiaCameroonCanadaChadChileChinaComorosCongo, Dem. Rep.Congo, Rep.Costa RicaCote d'IvoireCroatiaCuracaoCyprusCzech RepublicDenmarkDjiboutiDominicaDominican RepublicEcuadorEgypt, Arab Rep.El SalvadorEquatorial GuineaEritreaEstoniaEthiopiaEuro areaFijiFinlandFranceFrench PolynesiaGabonGambia, TheGeorgiaGermanyGhanaGreeceGrenadaGuatemalaGuineaGuinea-BissauGuyanaHaitiHondurasHong Kong SAR, ChinaHungaryIcelandIndiaIndonesiaIraqIrelandIsraelItalyJamaicaJapanJordanKazakhstanKenyaKiribatiKorea, Rep.KosovoKuwaitKyrgyz RepublicLatviaLebanonLesothoLiberiaLithuaniaLuxembourgMacao SAR, ChinaMacedonia, FYRMadagascarMalawiMalaysiaMaldivesMaliMaltaMarshall IslandsMauritaniaMauritiusMicronesia, Fed. Sts.MoldovaMongoliaMontenegroMoroccoMozambiqueMyanmarNamibiaNepalNetherlandsNew CaledoniaNew ZealandNicaraguaNigerNigeriaNorwayOmanPakistanPalauPanamaPapua New GuineaParaguayPeruPhilippinesPolandPortugalQatarRomaniaRussian FederationRwandaSamoaSao Tome and PrincipeSaudi ArabiaSenegalSerbiaSeychellesSierra LeoneSingaporeSint Maarten (Dutch part)Slovak RepublicSloveniaSolomon IslandsSouth AfricaSouth SudanSpainSri LankaSt. Kitts and NevisSt. LuciaSt. Vincent and the GrenadinesSudanSurinameSwazilandSwedenSwitzerlandSyrian Arab RepublicTajikistanTanzaniaThailandTimor-LesteTogoTongaTunisiaTurkeyTuvaluUgandaUkraineUnited KingdomUnited StatesUruguayVanuatuVenezuela, RBWest Bank and GazaYemen, Rep.ZambiaZimbabwe Timeline:
This timeline shows a graph from 1990 to 2016 of United States. No data until 1989. Number of actual observations by date: 27.
Source name:
World Development Indicators
Source organization:
International Monetary Fund, Balance of Payments Statistics Yearbook and data files.
Categories, topics:
Economy & Growth
Last updated:
apr 23, 2017
Indicators value changes by year
Minimum:
-7.22 bln
jan 1, 1991
Maximum:
13.2 bln
jan 1, 2002
At the date of observation
Value
Absolute change
Change from previous value
jan 1, 1990
-206.5 mln
-206.5 mln
0.0%
jan 1, 1991
-7.22 bln
-7.014 bln
3.4K%
jan 1, 1992
-5.13 bln
+2.09 bln
-28.95%
jan 1, 1993
1.449 bln
+6.579 bln
-128.25%
jan 1, 1994
-714.2 mln
-2.164 bln
-149.28%
jan 1, 1995
-1.111 bln
-397.0 mln
55.59%
jan 1, 1996
-221.5 mln
+889.7 mln
-80.07%
jan 1, 1997
-7.0 mln
+214.5 mln
-96.84%
jan 1, 1998
-256.3 mln
-249.3 mln
3.56K%
jan 1, 1999
-8.0 mln
+248.3 mln
-96.88%
jan 1, 2000
-4.175 bln
-4.167 bln
52.09K%
jan 1, 2001
-2.0 mln
+4.173 bln
-99.95%
jan 1, 2002
13.2 bln
+13.202 bln
-660.1K%
jan 1, 2003
-141.0 mln
-13.341 bln
-101.07%
jan 1, 2004
-1.82 bln
-1.679 bln
1.19K%
jan 1, 2005
3.047 bln
+4.867 bln
-267.42%
jan 1, 2006
13.115 bln
+10.068 bln
330.42%
jan 1, 2007
-1.788 bln
-14.903 bln
-113.63%
jan 1, 2008
384.0 mln
+2.172 bln
-121.48%
jan 1, 2009
6.011 bln
+5.627 bln
1.47K%
jan 1, 2010
-141.0 mln
-6.152 bln
-102.35%
jan 1, 2011
-158.0 mln
-17.0 mln
12.06%
jan 1, 2012
-1.186 bln
-1.028 bln
650.63%
jan 1, 2013
6.904 bln
+8.09 bln
-682.12%
jan 1, 2014
-413.0 mln
-7.317 bln
-105.98%
jan 1, 2015
-46.0 mln
+367.0 mln
-88.86%
jan 1, 2016
-43.0 mln
+3.0 mln
-6.52%
Ranking of countries by current statistics by years


Comments: