29
/
en
AIzaSyAYiBZKx7MnpbEhh9jyipgxe19OcubqV5w
April 1, 2024
273269
Ukraine
UKR
true
2
1
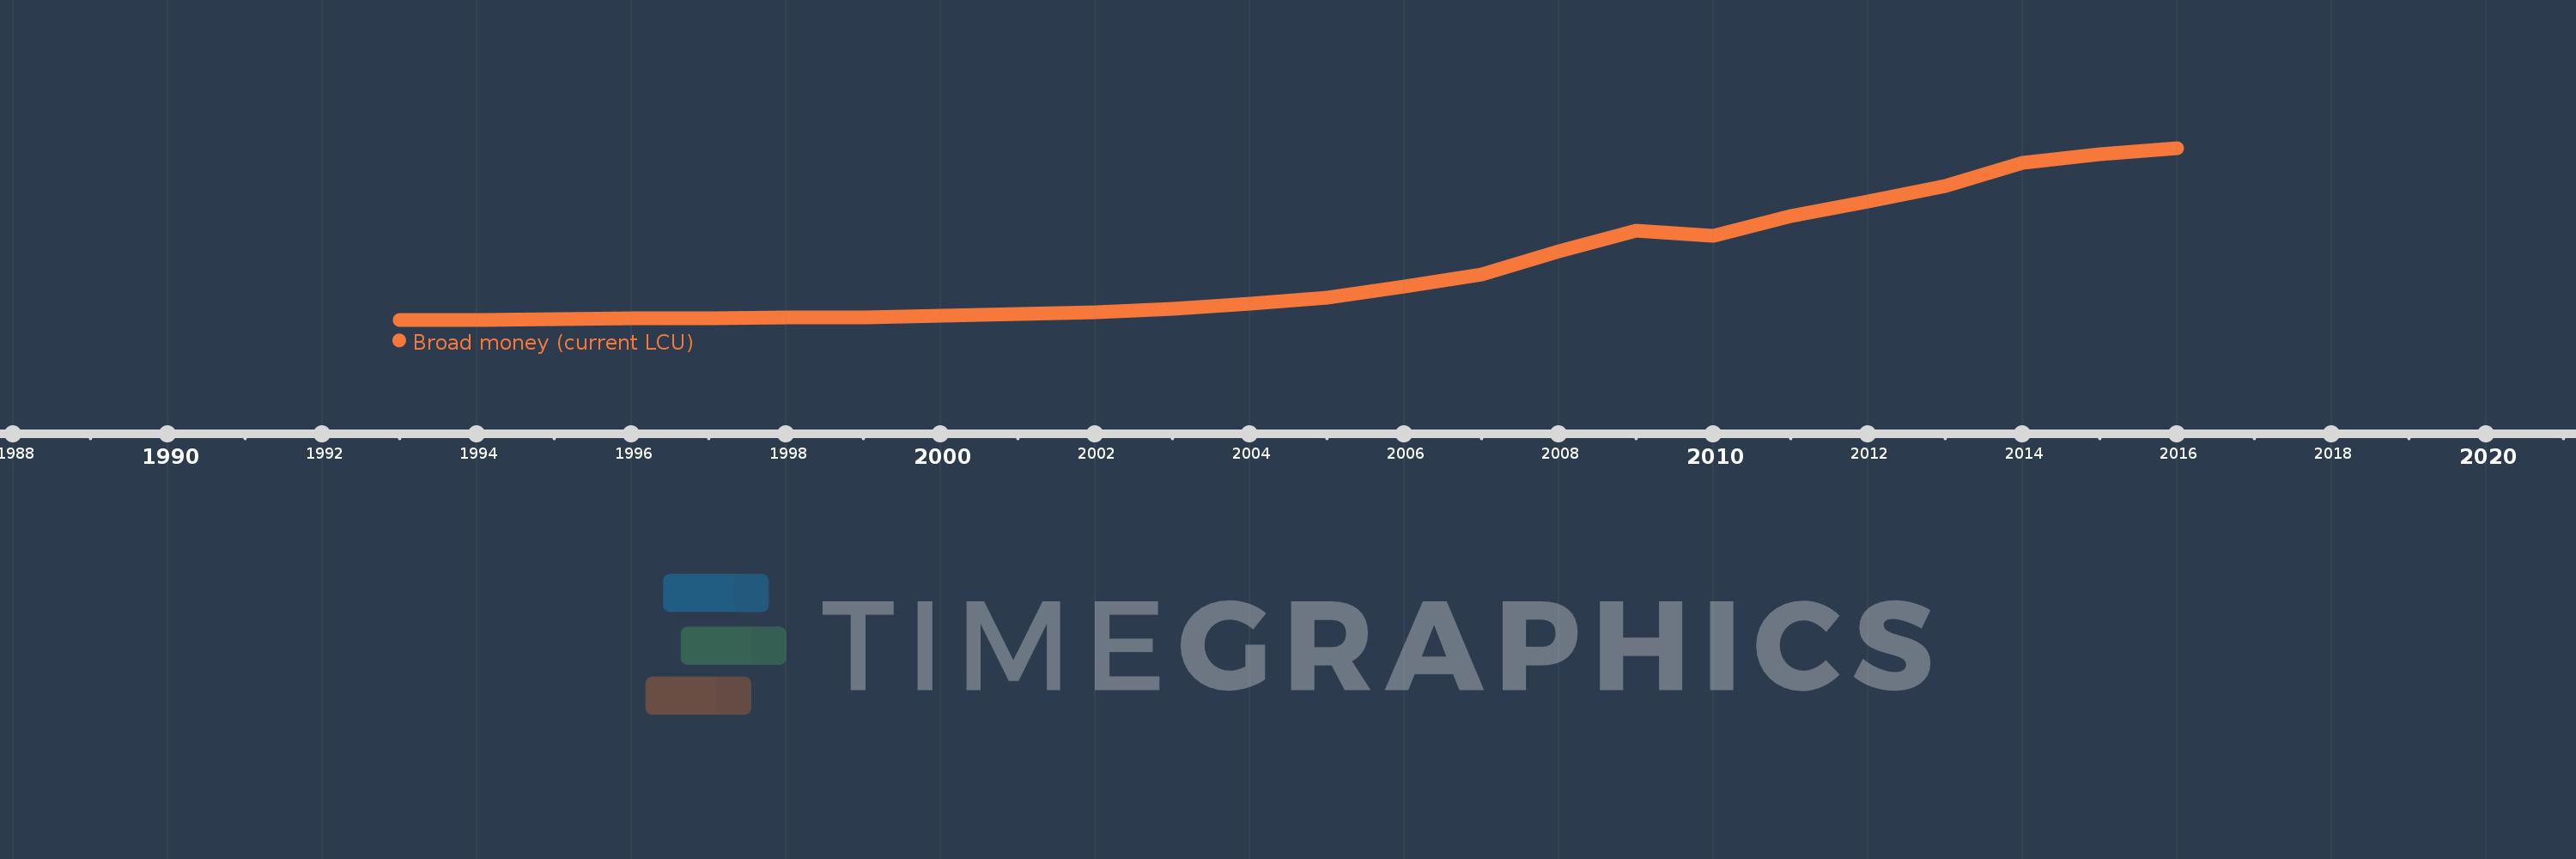
Broad money (current LCU)
2016,2015,2014,2013,2012,2011,2010,2009,2008,2007,2006,2005,2004,2003,2002,2001,2000,1999,1998,1997,1996,1995,1994,1993
This statistics in other country:
AfghanistanAlbaniaAlgeriaAngolaAntigua and BarbudaArgentinaArmeniaArubaAustraliaAzerbaijanBahamas, TheBahrainBangladeshBarbadosBelarusBelizeBeninBhutanBoliviaBosnia and HerzegovinaBotswanaBrazilBrunei DarussalamBulgariaBurkina FasoBurundiCabo VerdeCambodiaCameroonCanadaCentral African RepublicChadChileChinaColombiaComorosCongo, Dem. Rep.Congo, Rep.Costa RicaCote d'IvoireCroatiaCzech RepublicDenmarkDjiboutiDominicaDominican RepublicEcuadorEgypt, Arab Rep.El SalvadorEquatorial GuineaEritreaEstoniaEthiopiaEuro areaFijiGabonGambia, TheGeorgiaGhanaGrenadaGuatemalaGuineaGuinea-BissauGuyanaHaitiHondurasHong Kong SAR, ChinaHungaryIcelandIndiaIndonesiaIran, Islamic Rep.IraqIsraelJamaicaJapanJordanKazakhstanKenyaKorea, Rep.KuwaitKyrgyz RepublicLao PDRLatviaLebanonLesothoLiberiaLibyaLithuaniaMacao SAR, ChinaMacedonia, FYRMadagascarMalawiMalaysiaMaldivesMaliMauritaniaMauritiusMexicoMicronesia, Fed. Sts.MoldovaMongoliaMoroccoMozambiqueMyanmarNamibiaNepalNew ZealandNicaraguaNigerNigeriaNorwayOmanPakistanPanamaPapua New GuineaParaguayPeruPhilippinesPolandQatarRomaniaRussian FederationRwandaSamoaSao Tome and PrincipeSaudi ArabiaSenegalSerbiaSeychellesSierra LeoneSingaporeSlovak RepublicSolomon IslandsSouth AfricaSouth SudanSri LankaSt. Kitts and NevisSt. LuciaSt. Vincent and the GrenadinesSudanSurinameSwazilandSwedenSwitzerlandSyrian Arab RepublicTajikistanTanzaniaThailandTimor-LesteTogoTongaTrinidad and TobagoTunisiaTurkeyUgandaUkraineUnited Arab EmiratesUnited KingdomUnited StatesUruguayVanuatuVenezuela, RBVietnamWest Bank and GazaYemen, Rep.ZambiaZimbabwe Timeline:
This timeline shows a graph from 1993 to 2016 of Ukraine. No data until 1992. Number of actual observations by date: 24.
Source name:
World Development Indicators
Source organization:
International Monetary Fund, International Financial Statistics and data files.
Categories, topics:
Financial Sector
Last updated:
apr 23, 2017
Indicators value changes by year
Minimum:
25.218 mln
jan 1, 1993
Maximum:
994.062 bln
jan 1, 2016
At the date of observation
Value
Absolute change
Change from previous value
jan 1, 1993
25.218 mln
+25.218 mln
0.0%
jan 1, 1994
481.456 mln
+456.238 mln
1.81K%
jan 1, 1995
3.216 bln
+2.734 bln
567.91%
jan 1, 1996
6.93 bln
+3.714 bln
115.5%
jan 1, 1997
9.364 bln
+2.434 bln
35.13%
jan 1, 1998
12.541 bln
+3.176 bln
33.92%
jan 1, 1999
15.556 bln
+3.015 bln
24.04%
jan 1, 2000
21.869 bln
+6.313 bln
40.58%
jan 1, 2001
31.61 bln
+9.741 bln
44.54%
jan 1, 2002
45.186 bln
+13.576 bln
42.95%
jan 1, 2003
65.129 bln
+19.943 bln
44.14%
jan 1, 2004
95.334 bln
+30.205 bln
46.38%
jan 1, 2005
125.705 bln
+30.371 bln
31.86%
jan 1, 2006
194.071 bln
+68.366 bln
54.39%
jan 1, 2007
261.063 bln
+66.993 bln
34.52%
jan 1, 2008
396.156 bln
+135.093 bln
51.75%
jan 1, 2009
515.727 bln
+119.571 bln
30.18%
jan 1, 2010
487.298 bln
-28.429 bln
-5.51%
jan 1, 2011
597.872 bln
+110.573 bln
22.69%
jan 1, 2012
685.515 bln
+87.643 bln
14.66%
jan 1, 2013
773.199 bln
+87.684 bln
12.79%
jan 1, 2014
908.994 bln
+135.796 bln
17.56%
jan 1, 2015
956.728 bln
+47.733 bln
5.25%
jan 1, 2016
994.062 bln
+37.334 bln
3.9%
Ranking of countries by current statistics by years


Comments: