29
/
en
AIzaSyAYiBZKx7MnpbEhh9jyipgxe19OcubqV5w
April 1, 2024
273239
Ukraine
UKR
true
2
1
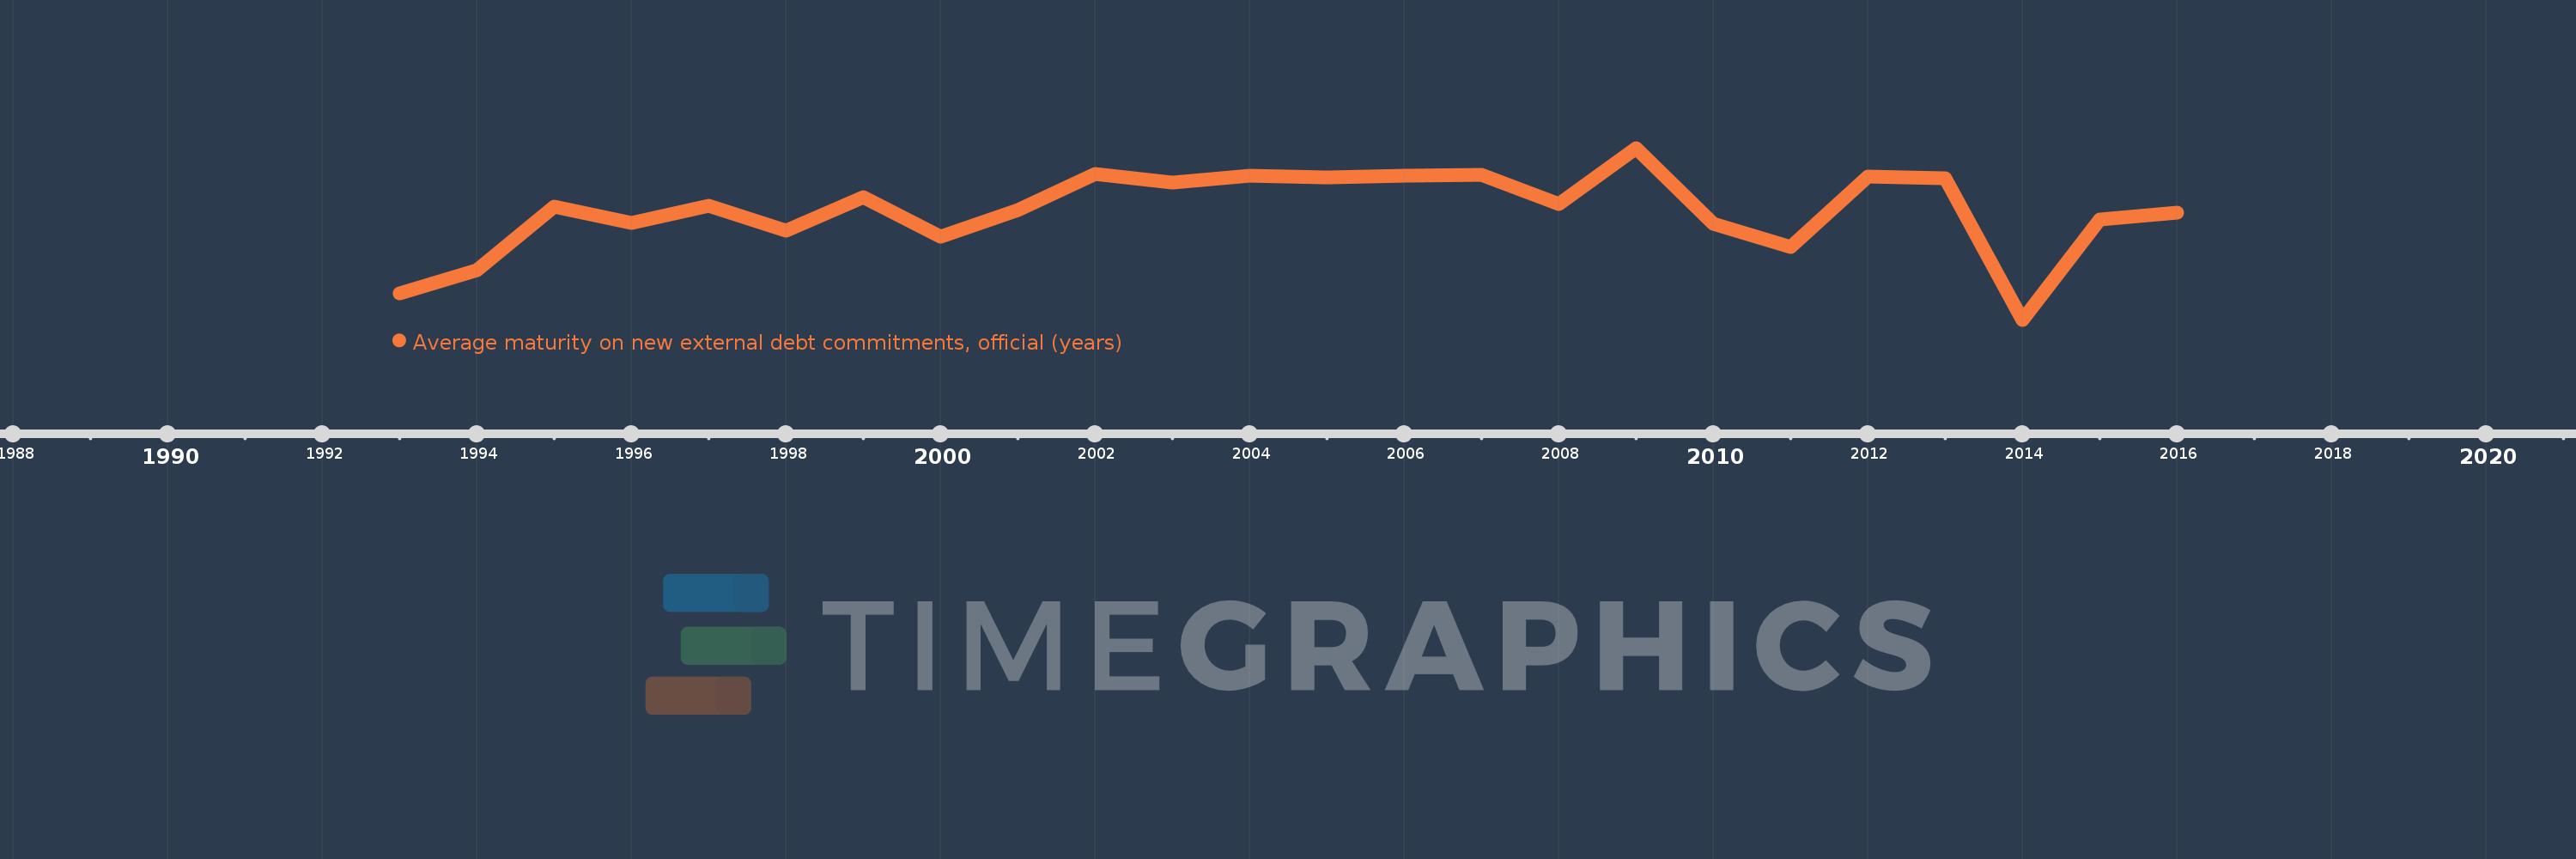
Average maturity on new external debt commitments, official (years)
2016,2015,2014,2013,2012,2011,2010,2009,2008,2007,2006,2005,2004,2003,2002,2001,2000,1999,1998,1997,1996,1995,1994,1993
This statistics in other country:
Timeline:
This timeline shows a graph from 1993 to 2016 of Ukraine. No data until 1992. Number of actual observations by date: 24.
Source name:
World Development Indicators
Source organization:
World Bank, International Debt Statistics.
Categories, topics:
External Debt
Last updated:
apr 23, 2017
Indicators value changes by year
Maximum:
23.663
jan 1, 2009
At the date of observation
Value
Absolute change
Change from previous value
jan 1, 1993
3.621
+3.621
0.0%
jan 1, 1994
6.854
+3.234
89.3%
jan 1, 1995
15.588
+8.734
127.42%
jan 1, 1996
13.379
-2.21
-14.17%
jan 1, 1997
15.756
+2.377
17.77%
jan 1, 1998
12.257
-3.499
-22.21%
jan 1, 1999
16.925
+4.668
38.09%
jan 1, 2000
11.494
-5.432
-32.09%
jan 1, 2001
15.164
+3.67
31.93%
jan 1, 2002
20.083
+4.92
32.44%
jan 1, 2003
18.929
-1.155
-5.75%
jan 1, 2004
19.843
+0.915
4.83%
jan 1, 2005
19.583
-0.26
-1.31%
jan 1, 2006
19.805
+0.221
1.13%
jan 1, 2007
20.001
+0.197
0.99%
jan 1, 2008
15.902
-4.099
-20.5%
jan 1, 2009
23.663
+7.761
48.81%
jan 1, 2010
13.18
-10.483
-44.3%
jan 1, 2011
10.021
-3.159
-23.97%
jan 1, 2012
19.673
+9.651
96.31%
jan 1, 2013
19.482
-0.191
-0.97%
jan 1, 2014
0.0
-19.482
-100.0%
jan 1, 2015
13.865
+13.865
%
jan 1, 2016
14.795
+0.931
6.71%
Ranking of countries by current statistics by years


Comments: