29
/
en
AIzaSyAYiBZKx7MnpbEhh9jyipgxe19OcubqV5w
April 1, 2024
272964
Uganda
UGA
true
2
1
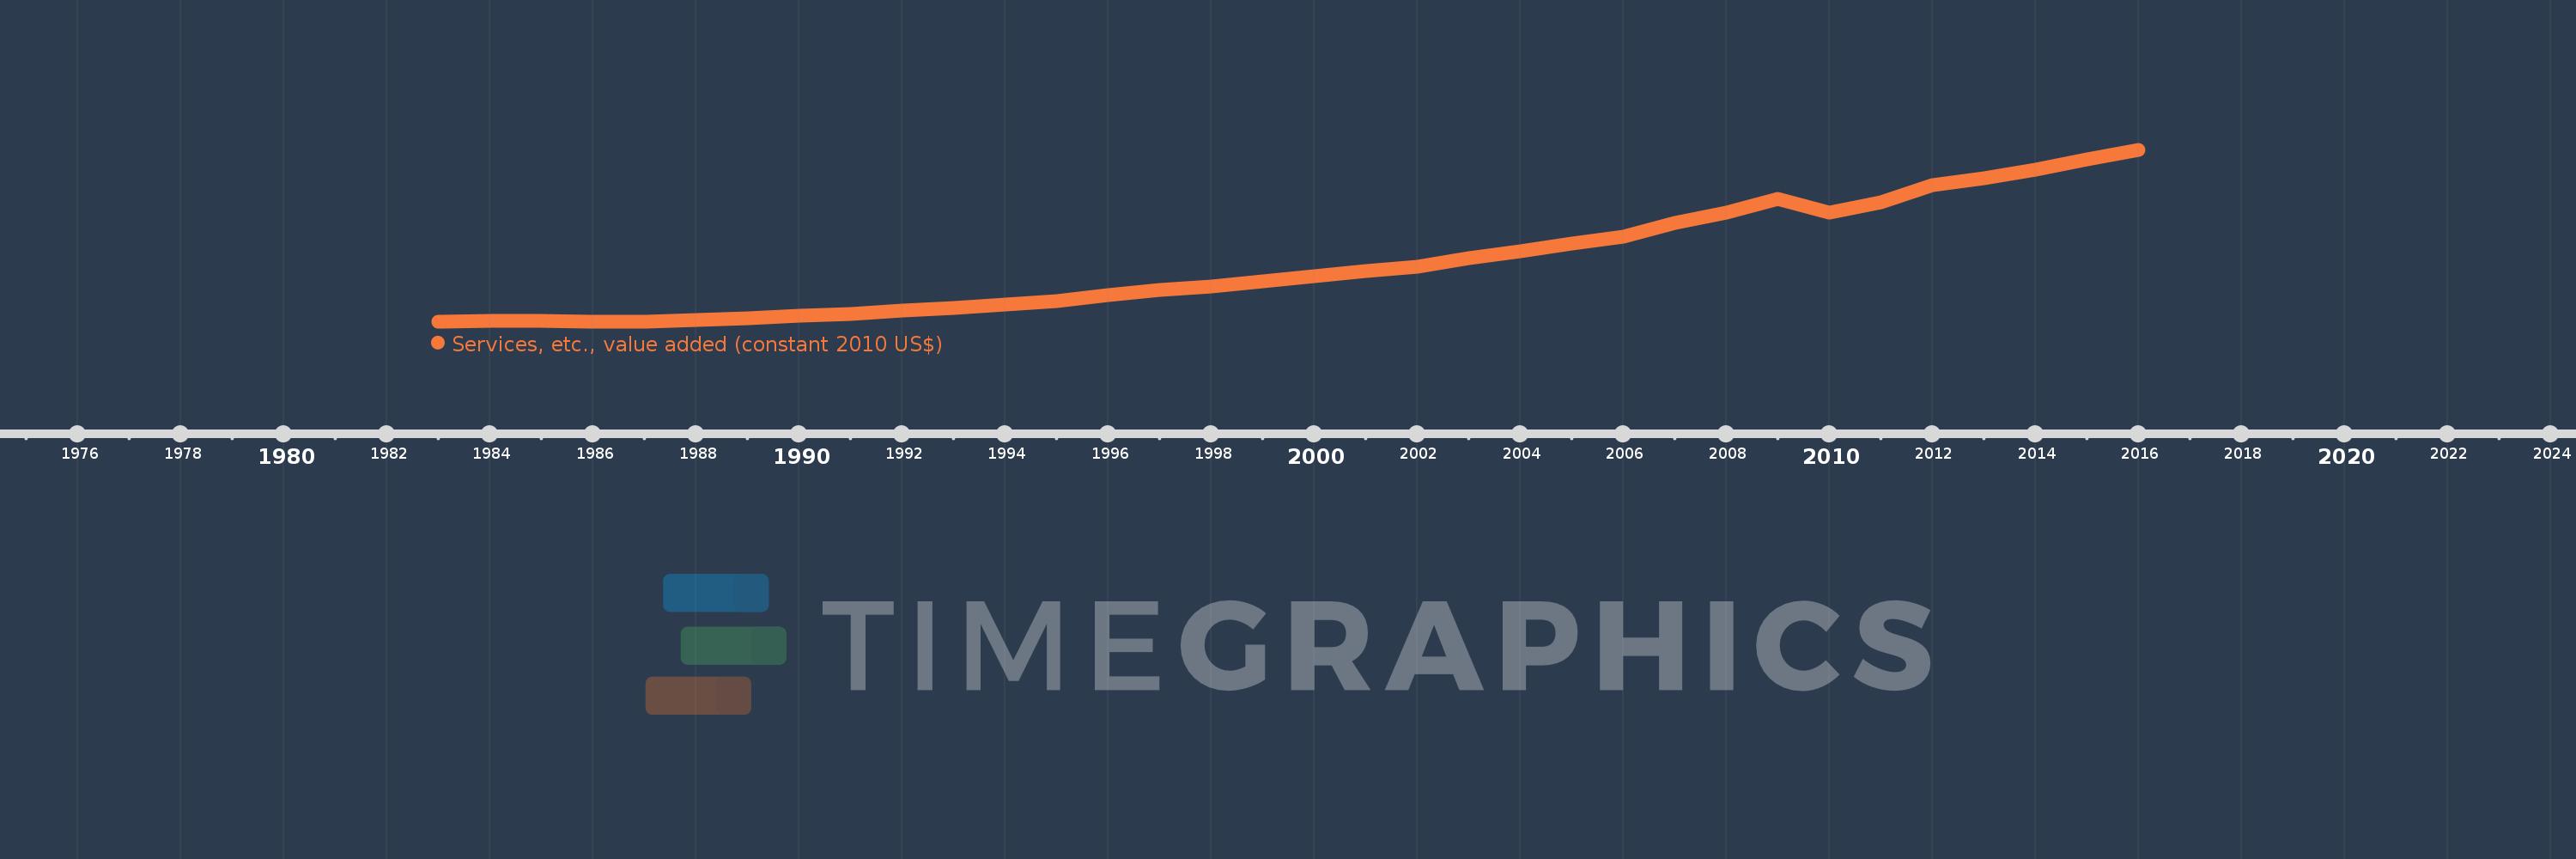
Services, etc., value added (constant 2010 US$)
2016,2015,2014,2013,2012,2011,2010,2009,2008,2007,2006,2005,2004,2003,2002,2001,2000,1999,1998,1997,1996,1995,1994,1993,1992,1991,1990,1989,1988,1987,1986,1985,1984,1983
This statistics in other country:
AfghanistanAlbaniaAlgeriaAndorraAntigua and BarbudaArab WorldArgentinaArmeniaArubaAustraliaAustriaAzerbaijanBahamas, TheBahrainBangladeshBarbadosBelarusBelgiumBelizeBeninBermudaBhutanBoliviaBosnia and HerzegovinaBotswanaBrazilBrunei DarussalamBulgariaBurkina FasoBurundiCabo VerdeCambodiaCameroonCanadaCaribbean small statesCentral African RepublicCentral Europe and the BalticsChadChileChinaColombiaComorosCongo, Dem. Rep.Congo, Rep.Costa RicaCote d'IvoireCroatiaCubaCyprusCzech RepublicDenmarkDominicaDominican RepublicEarly-demographic dividendEast Asia & PacificEast Asia & Pacific (excluding high income)East Asia & Pacific (IDA & IBRD countries)EcuadorEgypt, Arab Rep.El SalvadorEquatorial GuineaEstoniaEthiopiaEuro areaEurope & Central AsiaEurope & Central Asia (excluding high income)Europe & Central Asia (IDA & IBRD countries)European UnionFaroe IslandsFijiFinlandFragile and conflict affected situationsFranceGabonGambia, TheGeorgiaGermanyGhanaGreeceGrenadaGuatemalaGuineaGuinea-BissauGuyanaHeavily indebted poor countries (HIPC)High incomeHondurasHong Kong SAR, ChinaHungaryIBRD onlyIcelandIDA & IBRD totalIDA blendIDA onlyIDA totalIndiaIndonesiaIran, Islamic Rep.IraqIrelandItalyJamaicaJapanJordanKazakhstanKenyaKiribatiKorea, Rep.KosovoKuwaitKyrgyz RepublicLao PDRLate-demographic dividendLatin America & Caribbean Latin America & Caribbean (excluding high income)Latin America & the Caribbean (IDA & IBRD countries)LatviaLeast developed countries: UN classificationLebanonLesothoLiberiaLithuaniaLow & middle incomeLow incomeLower middle incomeLuxembourgMacao SAR, ChinaMacedonia, FYRMadagascarMalawiMalaysiaMaldivesMaliMaltaMarshall IslandsMauritaniaMauritiusMexicoMicronesia, Fed. Sts.Middle East & North AfricaMiddle East & North Africa (excluding high income)Middle East & North Africa (IDA & IBRD countries)Middle incomeMoldovaMongoliaMontenegroMoroccoMozambiqueMyanmarNamibiaNepalNetherlandsNew ZealandNicaraguaNigerNigeriaNorth AmericaNorwayOECD membersOmanOther small statesPacific island small statesPakistanPalauPanamaParaguayPeruPhilippinesPolandPortugalPost-demographic dividendPre-demographic dividendPuerto RicoQatarRomaniaRussian FederationRwandaSamoaSao Tome and PrincipeSaudi ArabiaSenegalSerbiaSeychellesSierra LeoneSingaporeSlovak RepublicSloveniaSmall statesSouth AfricaSouth AsiaSouth Asia (IDA & IBRD)SpainSri LankaSt. Kitts and NevisSt. LuciaSt. Vincent and the GrenadinesSub-Saharan Africa Sub-Saharan Africa (excluding high income)Sub-Saharan Africa (IDA & IBRD countries)SudanSurinameSwazilandSwedenSwitzerlandTajikistanTanzaniaThailandTimor-LesteTogoTongaTrinidad and TobagoTunisiaTurkeyTurkmenistanTuvaluUgandaUkraineUnited Arab EmiratesUnited KingdomUnited StatesUpper middle incomeUruguayUzbekistanVanuatuVenezuela, RBVietnamWest Bank and GazaWorldYemen, Rep.ZambiaZimbabwe Timeline:
This timeline shows a graph from 1983 to 2016 of Uganda. No data until 1982. Number of actual observations by date: 34.
Source name:
World Development Indicators
Source organization:
World Bank national accounts data, and OECD National Accounts data files.
Categories, topics:
Economy & Growth
Last updated:
apr 23, 2017
Indicators value changes by year
Minimum:
1.899 bln
jan 1, 1983
Maximum:
13.251 bln
jan 1, 2016
At the date of observation
Value
Absolute change
Change from previous value
jan 1, 1983
1.899 bln
+1.899 bln
0.0%
jan 1, 1984
2.0 bln
+101.364 mln
5.34%
jan 1, 1985
1.978 bln
-22.925 mln
-1.15%
jan 1, 1986
1.944 bln
-33.129 mln
-1.68%
jan 1, 1987
1.943 bln
-1.636 mln
-0.08%
jan 1, 1988
2.012 bln
+69.37 mln
3.57%
jan 1, 1989
2.158 bln
+145.387 mln
7.23%
jan 1, 1990
2.297 bln
+139.024 mln
6.44%
jan 1, 1991
2.447 bln
+150.171 mln
6.54%
jan 1, 1992
2.636 bln
+189.301 mln
7.74%
jan 1, 1993
2.829 bln
+193.336 mln
7.33%
jan 1, 1994
3.03 bln
+200.83 mln
7.1%
jan 1, 1995
3.266 bln
+235.302 mln
7.77%
jan 1, 1996
3.698 bln
+432.366 mln
13.24%
jan 1, 1997
4.015 bln
+317.158 mln
8.58%
jan 1, 1998
4.243 bln
+228.197 mln
5.68%
jan 1, 1999
4.603 bln
+360.237 mln
8.49%
jan 1, 2000
4.93 bln
+326.962 mln
7.1%
jan 1, 2001
5.273 bln
+342.972 mln
6.96%
jan 1, 2002
5.53 bln
+256.553 mln
4.87%
jan 1, 2003
6.137 bln
+607.281 mln
10.98%
jan 1, 2004
6.589 bln
+451.869 mln
7.36%
jan 1, 2005
7.107 bln
+517.466 mln
7.85%
jan 1, 2006
7.544 bln
+437.853 mln
6.16%
jan 1, 2007
8.463 bln
+918.24 mln
12.17%
jan 1, 2008
9.144 bln
+681.111 mln
8.05%
jan 1, 2009
10.027 bln
+883.463 mln
9.66%
jan 1, 2010
9.142 bln
-884.989 mln
-8.83%
jan 1, 2011
9.787 bln
+645.045 mln
7.06%
jan 1, 2012
10.933 bln
+1.145 bln
11.7%
jan 1, 2013
11.372 bln
+439.303 mln
4.02%
jan 1, 2014
11.981 bln
+609.139 mln
5.36%
jan 1, 2015
12.643 bln
+661.376 mln
5.52%
jan 1, 2016
13.251 bln
+608.19 mln
4.81%
Ranking of countries by current statistics by years


Comments: