29
/
en
AIzaSyAYiBZKx7MnpbEhh9jyipgxe19OcubqV5w
April 1, 2024
270003
Turkey
TUR
true
2
1
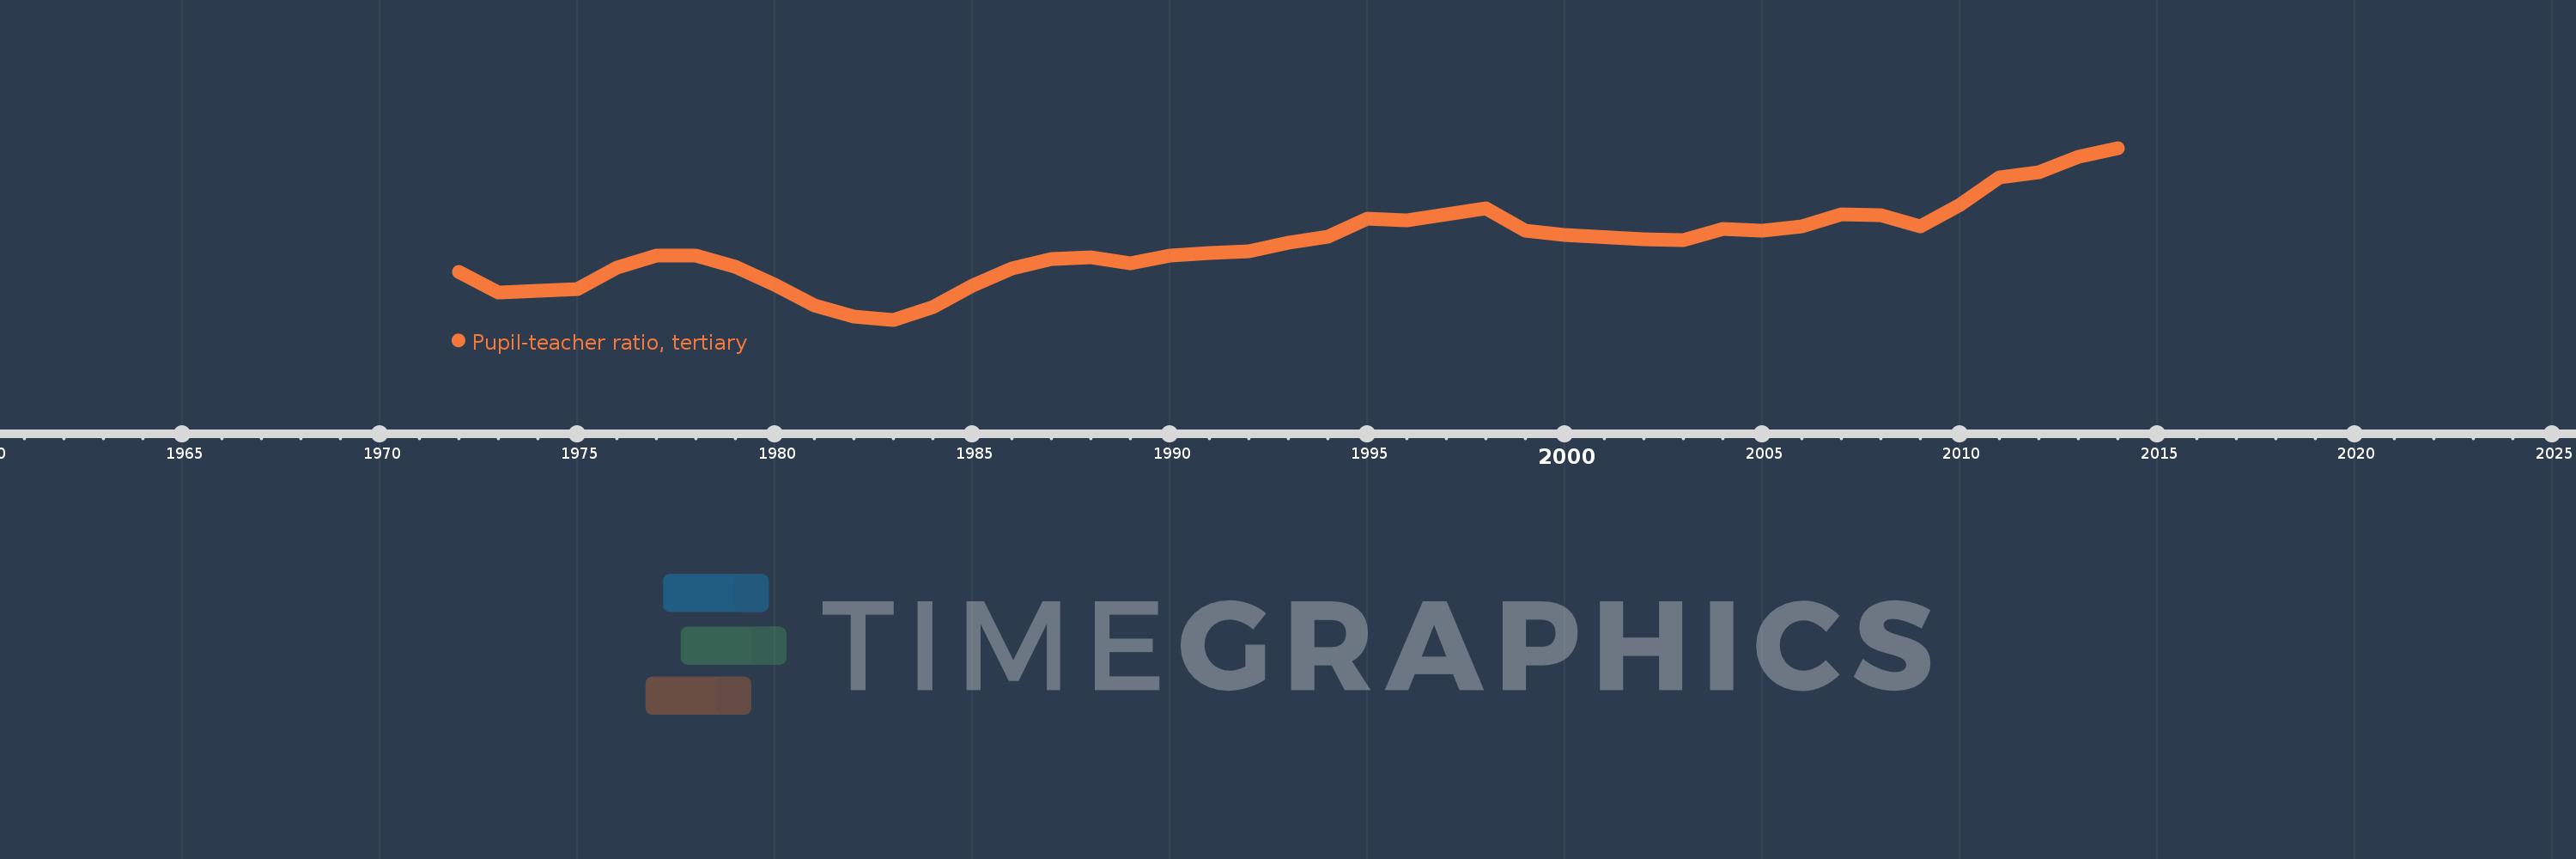
Pupil-teacher ratio, tertiary
2014,2013,2012,2011,2010,2009,2008,2007,2006,2005,2004,2003,2002,2000,1999,1998,1996,1995,1994,1993,1992,1991,1990,1989,1988,1987,1986,1985,1984,1983,1982,1981,1980,1979,1978,1977,1976,1975,1974,1973,1972
This statistics in other country:
AfghanistanAlbaniaAlgeriaAndorraAngolaAntigua and BarbudaArgentinaArmeniaArubaAustraliaAustriaAzerbaijanBahamas, TheBahrainBangladeshBarbadosBelarusBelgiumBelizeBeninBermudaBhutanBoliviaBosnia and HerzegovinaBotswanaBrazilBritish Virgin IslandsBrunei DarussalamBulgariaBurkina FasoBurundiCabo VerdeCambodiaCameroonCanadaCayman IslandsCentral African RepublicChadChileChinaColombiaComorosCongo, Dem. Rep.Congo, Rep.Costa RicaCote d'IvoireCroatiaCubaCyprusCzech RepublicDenmarkDjiboutiDominicaDominican RepublicEcuadorEgypt, Arab Rep.El SalvadorEquatorial GuineaEritreaEstoniaEthiopiaFijiFinlandFranceGabonGambia, TheGeorgiaGermanyGhanaGreeceGrenadaGuatemalaGuineaGuinea-BissauGuyanaHaitiHondurasHong Kong SAR, ChinaHungaryIcelandIndiaIndonesiaIran, Islamic Rep.IraqIrelandIsraelItalyJamaicaJapanJordanKazakhstanKorea, Dem. People’s Rep.Korea, Rep.KuwaitKyrgyz RepublicLao PDRLatviaLebanonLesothoLiberiaLibyaLiechtensteinLithuaniaLuxembourgMacao SAR, ChinaMacedonia, FYRMadagascarMalawiMalaysiaMaldivesMaliMaltaMarshall IslandsMauritaniaMauritiusMexicoMicronesia, Fed. Sts.MoldovaMongoliaMoroccoMozambiqueMyanmarNamibiaNepalNetherlandsNew ZealandNicaraguaNigerNigeriaNorwayOmanPakistanPalauPanamaPapua New GuineaParaguayPeruPhilippinesPolandPortugalPuerto RicoQatarRomaniaRussian FederationRwandaSamoaSao Tome and PrincipeSaudi ArabiaSenegalSerbiaSeychellesSierra LeoneSingaporeSint Maarten (Dutch part)Slovak RepublicSloveniaSomaliaSouth AfricaSpainSri LankaSt. Kitts and NevisSt. LuciaSt. Vincent and the GrenadinesSudanSurinameSwazilandSwedenSwitzerlandSyrian Arab RepublicTajikistanTanzaniaThailandTimor-LesteTogoTongaTrinidad and TobagoTunisiaTurkeyTurkmenistanUgandaUkraineUnited Arab EmiratesUnited KingdomUnited StatesUruguayUzbekistanVanuatuVenezuela, RBVietnamWest Bank and GazaYemen, Rep.ZambiaZimbabwe Timeline:
This timeline shows a graph from 1972 to 2014 of Turkey. No data until 1971. Number of actual observations by date: 41.
Source name:
World Development Indicators
Source organization:
United Nations Educational, Scientific, and Cultural Organization (UNESCO) Institute for Statistics.
Categories, topics:
Education
Last updated:
apr 23, 2017
Indicators value changes by year
Minimum:
10.891
jan 1, 1983
Maximum:
38.083
jan 1, 2014
At the date of observation
Value
Absolute change
Change from previous value
jan 1, 1972
18.398
+18.398
0.0%
jan 1, 1973
15.214
-3.183
-17.3%
jan 1, 1974
15.505
+0.291
1.91%
jan 1, 1975
15.738
+0.233
1.5%
jan 1, 1976
19.16
+3.422
21.74%
jan 1, 1977
21.021
+1.86
9.71%
jan 1, 1978
20.997
-0.024
-0.11%
jan 1, 1979
19.288
-1.709
-8.14%
jan 1, 1980
16.404
-2.884
-14.95%
jan 1, 1981
13.171
-3.233
-19.71%
jan 1, 1982
11.41
-1.762
-13.37%
jan 1, 1983
10.891
-0.519
-4.55%
jan 1, 1984
12.924
+2.034
18.67%
jan 1, 1985
16.352
+3.428
26.52%
jan 1, 1986
19.009
+2.657
16.25%
jan 1, 1987
20.463
+1.454
7.65%
jan 1, 1988
20.716
+0.253
1.24%
jan 1, 1989
19.82
-0.895
-4.32%
jan 1, 1990
20.981
+1.16
5.85%
jan 1, 1991
21.402
+0.422
2.01%
jan 1, 1992
21.756
+0.354
1.65%
jan 1, 1993
23.084
+1.328
6.1%
jan 1, 1994
24.013
+0.929
4.02%
jan 1, 1995
26.912
+2.899
12.07%
jan 1, 1996
26.637
-0.275
-1.02%
jan 1, 1998
28.502
+1.866
7.0%
jan 1, 1999
24.993
-3.509
-12.31%
jan 1, 2000
24.36
-0.633
-2.53%
jan 1, 2002
23.68
-0.68
-2.79%
jan 1, 2003
23.537
-0.143
-0.6%
jan 1, 2004
25.213
+1.677
7.12%
jan 1, 2005
25.033
-0.181
-0.72%
jan 1, 2006
25.657
+0.625
2.5%
jan 1, 2007
27.633
+1.976
7.7%
jan 1, 2008
27.468
-0.166
-0.6%
jan 1, 2009
25.643
-1.825
-6.64%
jan 1, 2010
29.096
+3.454
13.47%
jan 1, 2011
33.477
+4.38
15.05%
jan 1, 2012
34.235
+0.759
2.27%
jan 1, 2013
36.634
+2.398
7.01%
jan 1, 2014
38.083
+1.449
3.96%
Ranking of countries by current statistics by years


Comments: