29
/
en
AIzaSyAYiBZKx7MnpbEhh9jyipgxe19OcubqV5w
April 1, 2024
269402
Turkey
TUR
true
2
1
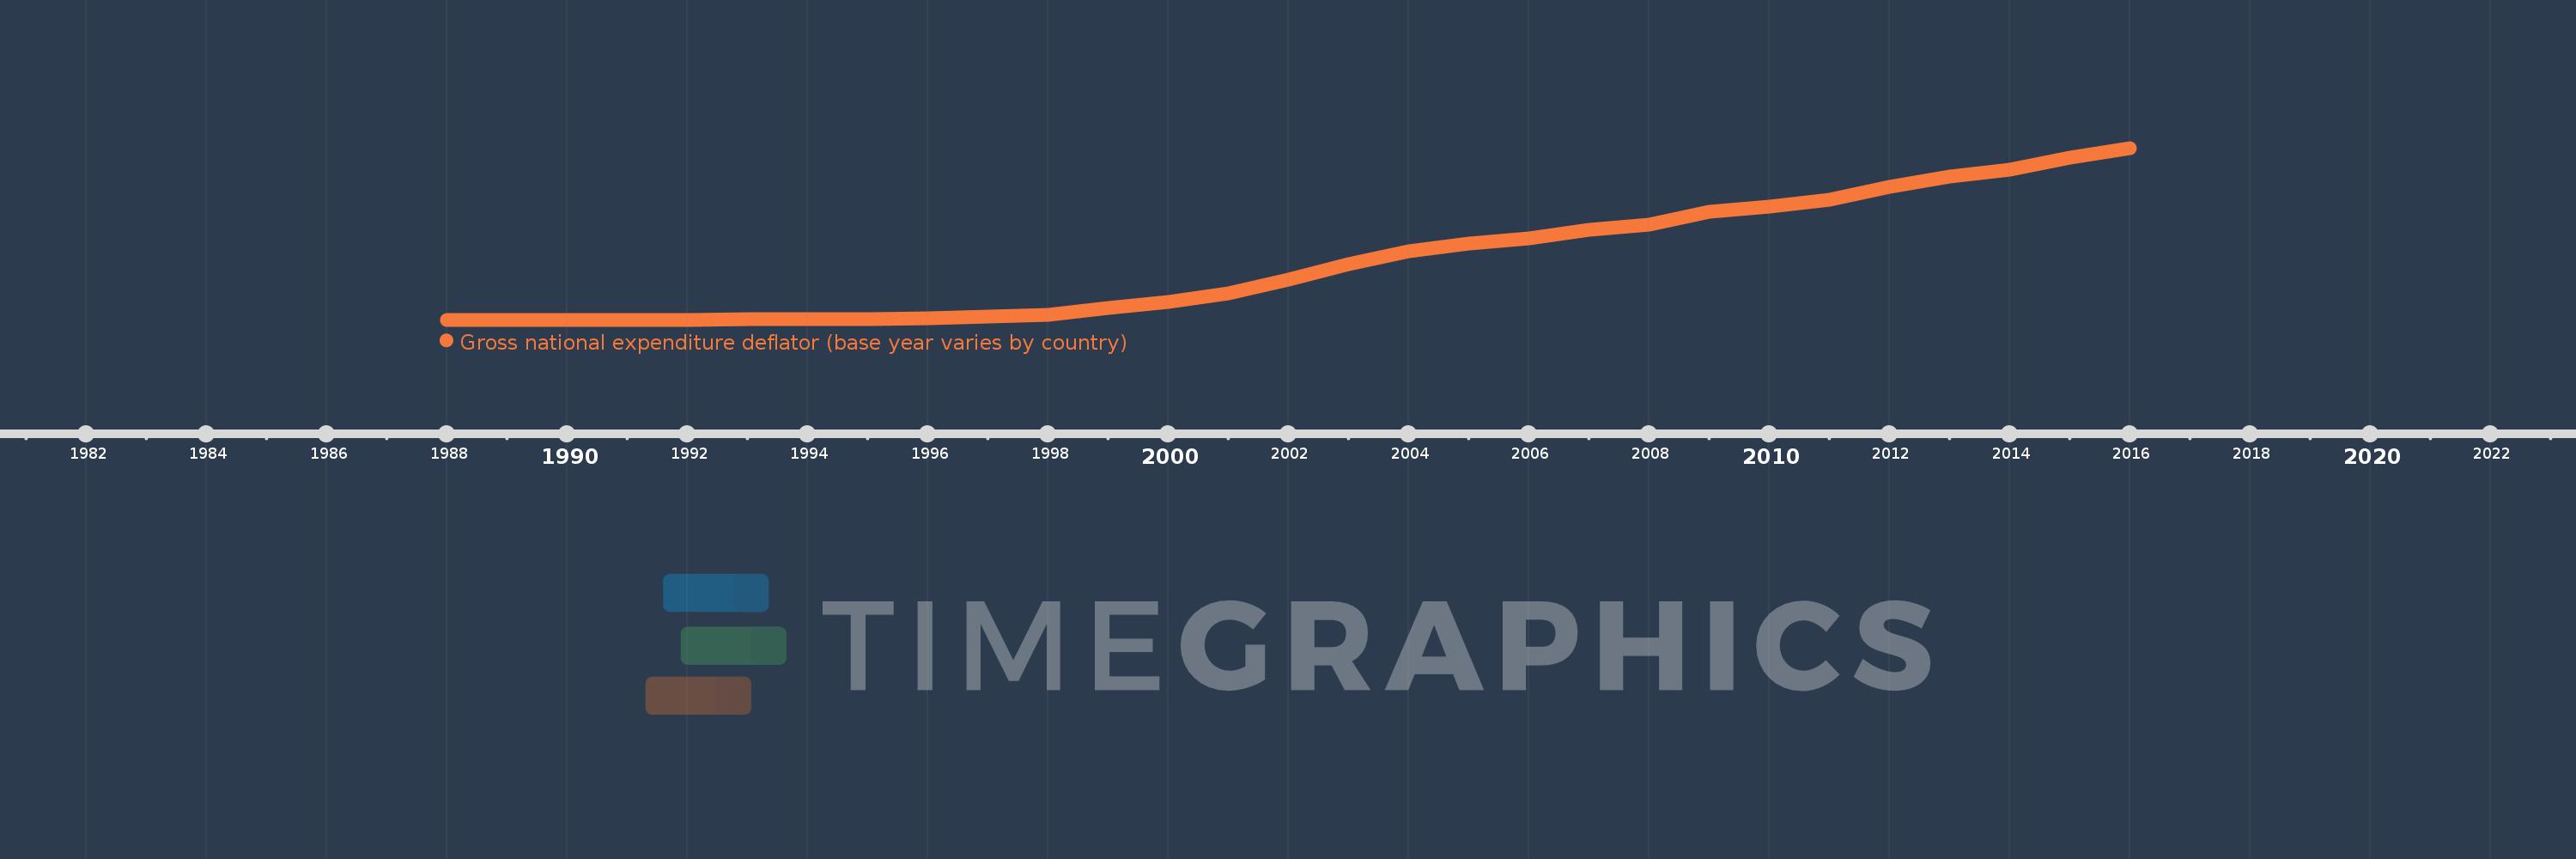
Gross national expenditure deflator (base year varies by country)
2016,2015,2014,2013,2012,2011,2010,2009,2008,2007,2006,2005,2004,2003,2002,2001,2000,1999,1998,1997,1996,1995,1994,1993,1992,1991,1990,1989,1988
This statistics in other country:
AlbaniaAlgeriaAngolaAntigua and BarbudaArgentinaArmeniaAustraliaAustriaAzerbaijanBahamas, TheBahrainBangladeshBarbadosBelarusBelgiumBelizeBeninBhutanBoliviaBosnia and HerzegovinaBotswanaBrazilBrunei DarussalamBulgariaBurkina FasoBurundiCabo VerdeCambodiaCameroonCanadaChadChileChinaColombiaComorosCongo, Dem. Rep.Congo, Rep.Costa RicaCote d'IvoireCroatiaCubaCyprusCzech RepublicDenmarkDjiboutiDominican RepublicEcuadorEgypt, Arab Rep.El SalvadorEquatorial GuineaEritreaEstoniaEthiopiaFijiFinlandFranceGabonGambia, TheGeorgiaGermanyGhanaGreeceGuatemalaGuineaGuinea-BissauHaitiHondurasHong Kong SAR, ChinaHungaryIcelandIndiaIndonesiaIran, Islamic Rep.IrelandIsraelItalyJamaicaJapanJordanKazakhstanKenyaKorea, Rep.KosovoKuwaitKyrgyz RepublicLao PDRLatviaLebanonLiberiaLibyaLithuaniaLuxembourgMacao SAR, ChinaMacedonia, FYRMadagascarMalawiMalaysiaMaliMaltaMauritaniaMauritiusMexicoMoldovaMongoliaMontenegroMoroccoMozambiqueMyanmarNamibiaNepalNetherlandsNew ZealandNicaraguaNigerNigeriaNorwayOmanPakistanPanamaPapua New GuineaParaguayPeruPhilippinesPolandPortugalPuerto RicoQatarRomaniaRussian FederationRwandaSamoaSaudi ArabiaSenegalSerbiaSeychellesSierra LeoneSingaporeSlovak RepublicSloveniaSomaliaSouth AfricaSouth SudanSpainSri LankaSudanSurinameSwazilandSwedenSwitzerlandSyrian Arab RepublicTajikistanTanzaniaThailandTimor-LesteTogoTrinidad and TobagoTunisiaTurkeyTurkmenistanUgandaUkraineUnited Arab EmiratesUnited KingdomUnited StatesUruguayUzbekistanVanuatuVenezuela, RBVietnamWest Bank and GazaZambiaZimbabwe Timeline:
This timeline shows a graph from 1988 to 2016 of Turkey. No data until 1987. Number of actual observations by date: 29.
Source name:
World Development Indicators
Source organization:
World Bank national accounts data, and OECD National Accounts data files.
Categories, topics:
Economy & Growth
Last updated:
apr 23, 2017
Indicators value changes by year
Maximum:
1.512K
jan 1, 2016
At the date of observation
Value
Absolute change
Change from previous value
jan 1, 1988
0.169
+0.169
0.0%
jan 1, 1989
0.284
+0.115
67.67%
jan 1, 1990
0.508
+0.224
78.83%
jan 1, 1991
0.8
+0.292
57.53%
jan 1, 1992
1.269
+0.469
58.64%
jan 1, 1993
2.1
+0.831
65.48%
jan 1, 1994
3.512
+1.412
67.26%
jan 1, 1995
7.123
+3.611
102.8%
jan 1, 1996
13.61
+6.487
91.08%
jan 1, 1997
24.584
+10.974
80.63%
jan 1, 1998
44.161
+19.578
79.64%
jan 1, 1999
100.0
+55.839
126.44%
jan 1, 2000
153.352
+53.352
53.35%
jan 1, 2001
233.457
+80.105
52.24%
jan 1, 2002
356.098
+122.641
52.53%
jan 1, 2003
489.807
+133.709
37.55%
jan 1, 2004
600.11
+110.302
22.52%
jan 1, 2005
670.652
+70.542
11.75%
jan 1, 2006
716.819
+46.168
6.88%
jan 1, 2007
793.996
+77.176
10.77%
jan 1, 2008
837.343
+43.348
5.46%
jan 1, 2009
948.723
+111.379
13.3%
jan 1, 2010
993.684
+44.961
4.74%
jan 1, 2011
1.054K
+60.177
6.06%
jan 1, 2012
1.17K
+116.47
11.05%
jan 1, 2013
1.259K
+88.795
7.59%
jan 1, 2014
1.322K
+63.251
5.02%
jan 1, 2015
1.429K
+106.902
8.08%
jan 1, 2016
1.512K
+82.384
5.76%
Ranking of countries by current statistics by years


Comments: