29
/
en
AIzaSyAYiBZKx7MnpbEhh9jyipgxe19OcubqV5w
April 1, 2024
268996
Turkey
TUR
true
2
1
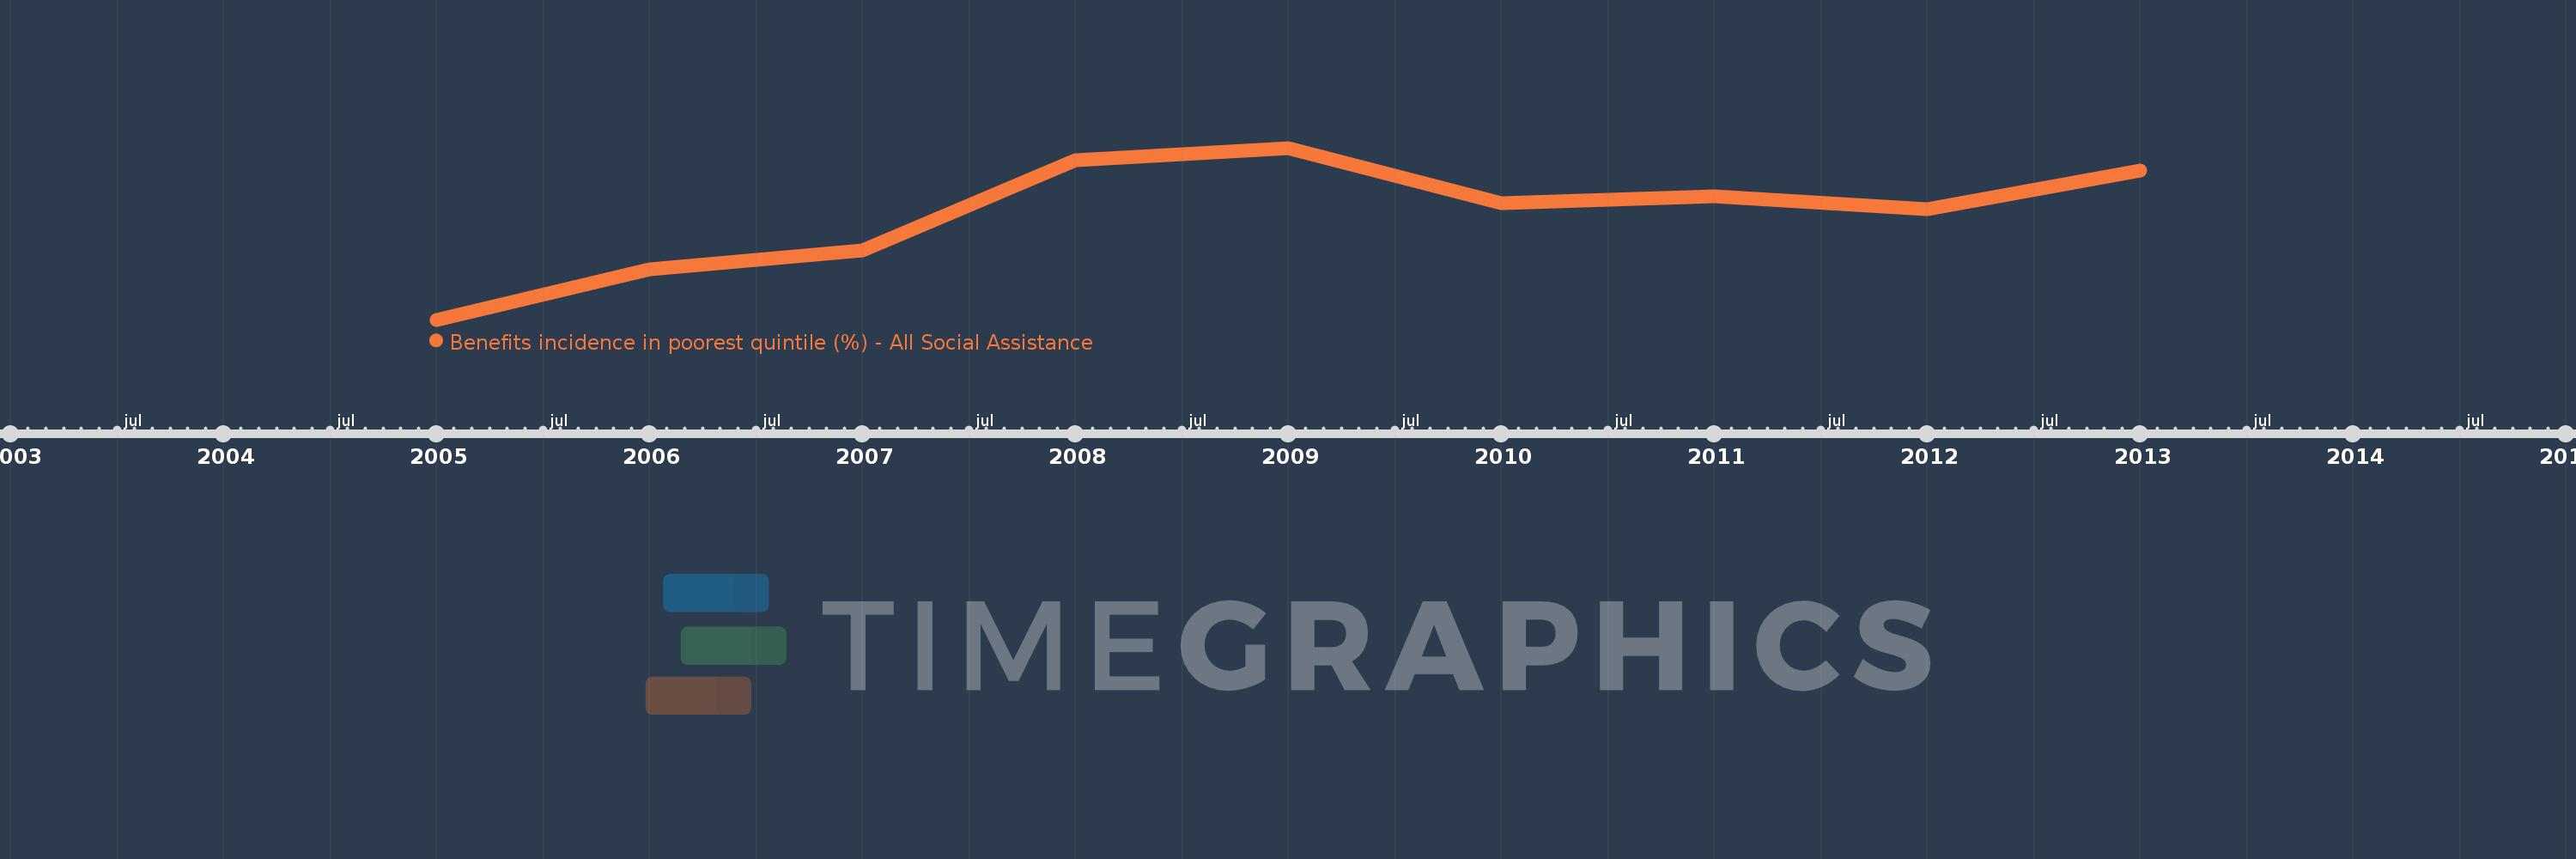
Benefits incidence in poorest quintile (%) - All Social Assistance
2013,2012,2011,2010,2009,2008,2007,2006,2005
This statistics in other country:
Timeline:
This timeline shows a graph from 2005 to 2013 of Turkey. No data until 2004. Number of actual observations by date: 9.
Source name:
World Development Indicators
Source organization:
The Atlas of Social Protection: Indicators of Resilience and Equity (ASPIRE)
Categories, topics:
Social Protection & Labor
Last updated:
apr 23, 2017
Indicators value changes by year
Minimum:
20.807
jan 1, 2005
Maximum:
41.099
jan 1, 2009
At the date of observation
Value
Absolute change
Change from previous value
jan 1, 2005
20.807
+20.807
0.0%
jan 1, 2006
26.733
+5.926
28.48%
jan 1, 2007
28.956
+2.223
8.32%
jan 1, 2008
39.652
+10.695
36.94%
jan 1, 2009
41.099
+1.448
3.65%
jan 1, 2010
34.566
-6.534
-15.9%
jan 1, 2011
35.429
+0.864
2.5%
jan 1, 2012
33.854
-1.576
-4.45%
jan 1, 2013
38.43
+4.576
13.52%
Ranking of countries by current statistics by years


Comments: