29
/
en
AIzaSyAYiBZKx7MnpbEhh9jyipgxe19OcubqV5w
April 1, 2024
268690
Tunisia
TUN
true
2
1
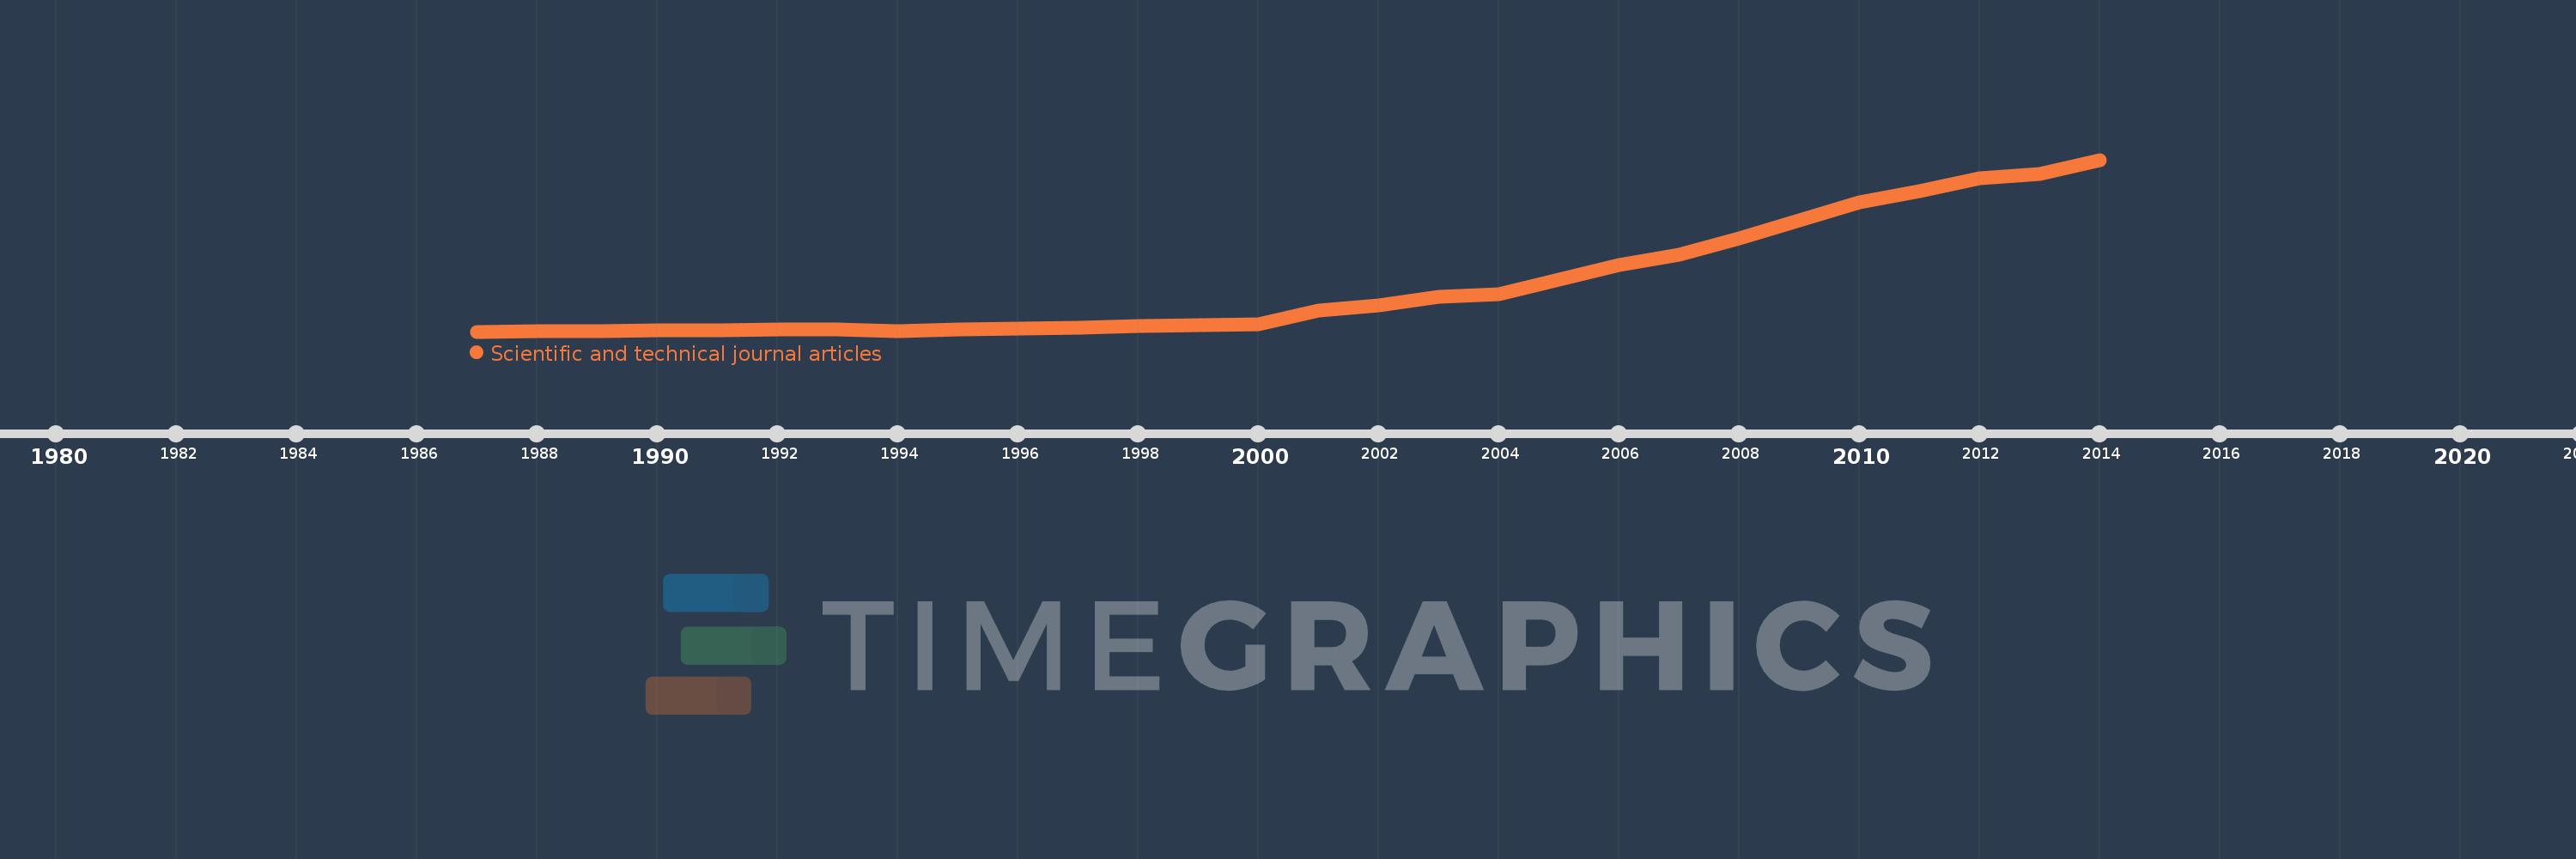
Scientific and technical journal articles
2014,2013,2012,2011,2010,2009,2008,2007,2006,2005,2004,2003,2002,2001,2000,1999,1998,1997,1996,1995,1994,1993,1992,1991,1990,1989,1988,1987
This statistics in other country:
AfghanistanAlbaniaAlgeriaAndorraAngolaAntigua and BarbudaArab WorldArgentinaArmeniaAustraliaAustriaAzerbaijanBahamas, TheBahrainBangladeshBarbadosBelarusBelgiumBelizeBeninBhutanBoliviaBosnia and HerzegovinaBotswanaBrazilBrunei DarussalamBulgariaBurkina FasoBurundiCabo VerdeCambodiaCameroonCanadaCaribbean small statesCentral African RepublicCentral Europe and the BalticsChadChileChinaColombiaComorosCongo, Dem. Rep.Congo, Rep.Costa RicaCote d'IvoireCroatiaCubaCyprusCzech RepublicDenmarkDjiboutiDominicaDominican RepublicEarly-demographic dividendEast Asia & PacificEast Asia & Pacific (excluding high income)East Asia & Pacific (IDA & IBRD countries)EcuadorEgypt, Arab Rep.El SalvadorEquatorial GuineaEritreaEstoniaEthiopiaEuro areaEurope & Central AsiaEurope & Central Asia (excluding high income)Europe & Central Asia (IDA & IBRD countries)European UnionFijiFinlandFragile and conflict affected situationsFranceGabonGambia, TheGeorgiaGermanyGhanaGreeceGrenadaGuatemalaGuineaGuinea-BissauGuyanaHaitiHeavily indebted poor countries (HIPC)High incomeHondurasHong Kong SAR, ChinaHungaryIBRD onlyIcelandIDA & IBRD totalIDA blendIDA onlyIDA totalIndiaIndonesiaIran, Islamic Rep.IraqIrelandIsraelItalyJamaicaJapanJordanKazakhstanKenyaKiribatiKorea, Dem. People’s Rep.Korea, Rep.KosovoKuwaitKyrgyz RepublicLao PDRLate-demographic dividendLatin America & Caribbean Latin America & Caribbean (excluding high income)Latin America & the Caribbean (IDA & IBRD countries)LatviaLeast developed countries: UN classificationLebanonLesothoLiberiaLibyaLiechtensteinLithuaniaLow & middle incomeLow incomeLower middle incomeLuxembourgMacedonia, FYRMadagascarMalawiMalaysiaMaldivesMaliMaltaMarshall IslandsMauritaniaMauritiusMexicoMicronesia, Fed. Sts.Middle East & North AfricaMiddle East & North Africa (excluding high income)Middle East & North Africa (IDA & IBRD countries)Middle incomeMoldovaMonacoMongoliaMontenegroMoroccoMozambiqueMyanmarNamibiaNauruNepalNetherlandsNew ZealandNicaraguaNigerNigeriaNorth AmericaNorwayOECD membersOmanOther small statesPacific island small statesPakistanPalauPanamaPapua New GuineaParaguayPeruPhilippinesPolandPortugalPost-demographic dividendPre-demographic dividendQatarRomaniaRussian FederationRwandaSamoaSan MarinoSao Tome and PrincipeSaudi ArabiaSenegalSerbiaSeychellesSierra LeoneSingaporeSlovak RepublicSloveniaSmall statesSolomon IslandsSomaliaSouth AfricaSouth AsiaSouth Asia (IDA & IBRD)SpainSri LankaSt. Kitts and NevisSt. LuciaSt. Vincent and the GrenadinesSub-Saharan Africa Sub-Saharan Africa (excluding high income)Sub-Saharan Africa (IDA & IBRD countries)SudanSurinameSwazilandSwedenSwitzerlandSyrian Arab RepublicTajikistanTanzaniaThailandTogoTongaTrinidad and TobagoTunisiaTurkeyTurkmenistanTuvaluUgandaUkraineUnited Arab EmiratesUnited KingdomUnited StatesUpper middle incomeUruguayUzbekistanVanuatuVenezuela, RBVietnamWest Bank and GazaWorldYemen, Rep.ZambiaZimbabwe Timeline:
This timeline shows a graph from 1987 to 2014 of Tunisia. No data until 1986. Number of actual observations by date: 28.
Source name:
World Development Indicators
Source organization:
National Science Foundation, Science and Engineering Indicators.
Categories, topics:
Science & Technology
Last updated:
apr 23, 2017
Indicators value changes by year
Maximum:
4.207K
jan 1, 2014
At the date of observation
Value
Absolute change
Change from previous value
jan 1, 1987
76.0
+76.0
0.0%
jan 1, 1988
83.0
+7.0
9.21%
jan 1, 1989
96.0
+13.0
15.66%
jan 1, 1990
107.0
+11.0
11.46%
jan 1, 1991
104.0
-3.0
-2.8%
jan 1, 1992
121.0
+17.0
16.35%
jan 1, 1993
131.0
+10.0
8.26%
jan 1, 1994
91.0
-40.0
-30.53%
jan 1, 1995
135.0
+44.0
48.35%
jan 1, 1996
143.0
+8.0
5.93%
jan 1, 1997
160.4
+17.4
12.17%
jan 1, 1998
220.2
+59.8
37.28%
jan 1, 1999
226.8
+6.6
3.0%
jan 1, 2000
256.8
+30.0
13.23%
jan 1, 2001
590.0
+333.2
129.75%
jan 1, 2002
712.7
+122.7
20.8%
jan 1, 2003
906.1
+193.4
27.14%
jan 1, 2004
975.2
+69.1
7.63%
jan 1, 2005
1.33K
+355.2
36.42%
jan 1, 2006
1.67K
+339.6
25.53%
jan 1, 2007
1.918K
+247.9
14.84%
jan 1, 2008
2.32K
+402.1
20.97%
jan 1, 2009
2.749K
+428.6
18.47%
jan 1, 2010
3.195K
+445.9
16.22%
jan 1, 2011
3.462K
+267.4
8.37%
jan 1, 2012
3.772K
+309.9
8.95%
jan 1, 2013
3.86K
+88.0
2.33%
jan 1, 2014
4.207K
+347.0
8.99%
Ranking of countries by current statistics by years


Comments: