29
/
en
AIzaSyAYiBZKx7MnpbEhh9jyipgxe19OcubqV5w
April 1, 2024
267456
Trinidad and Tobago
TTO
true
2
1
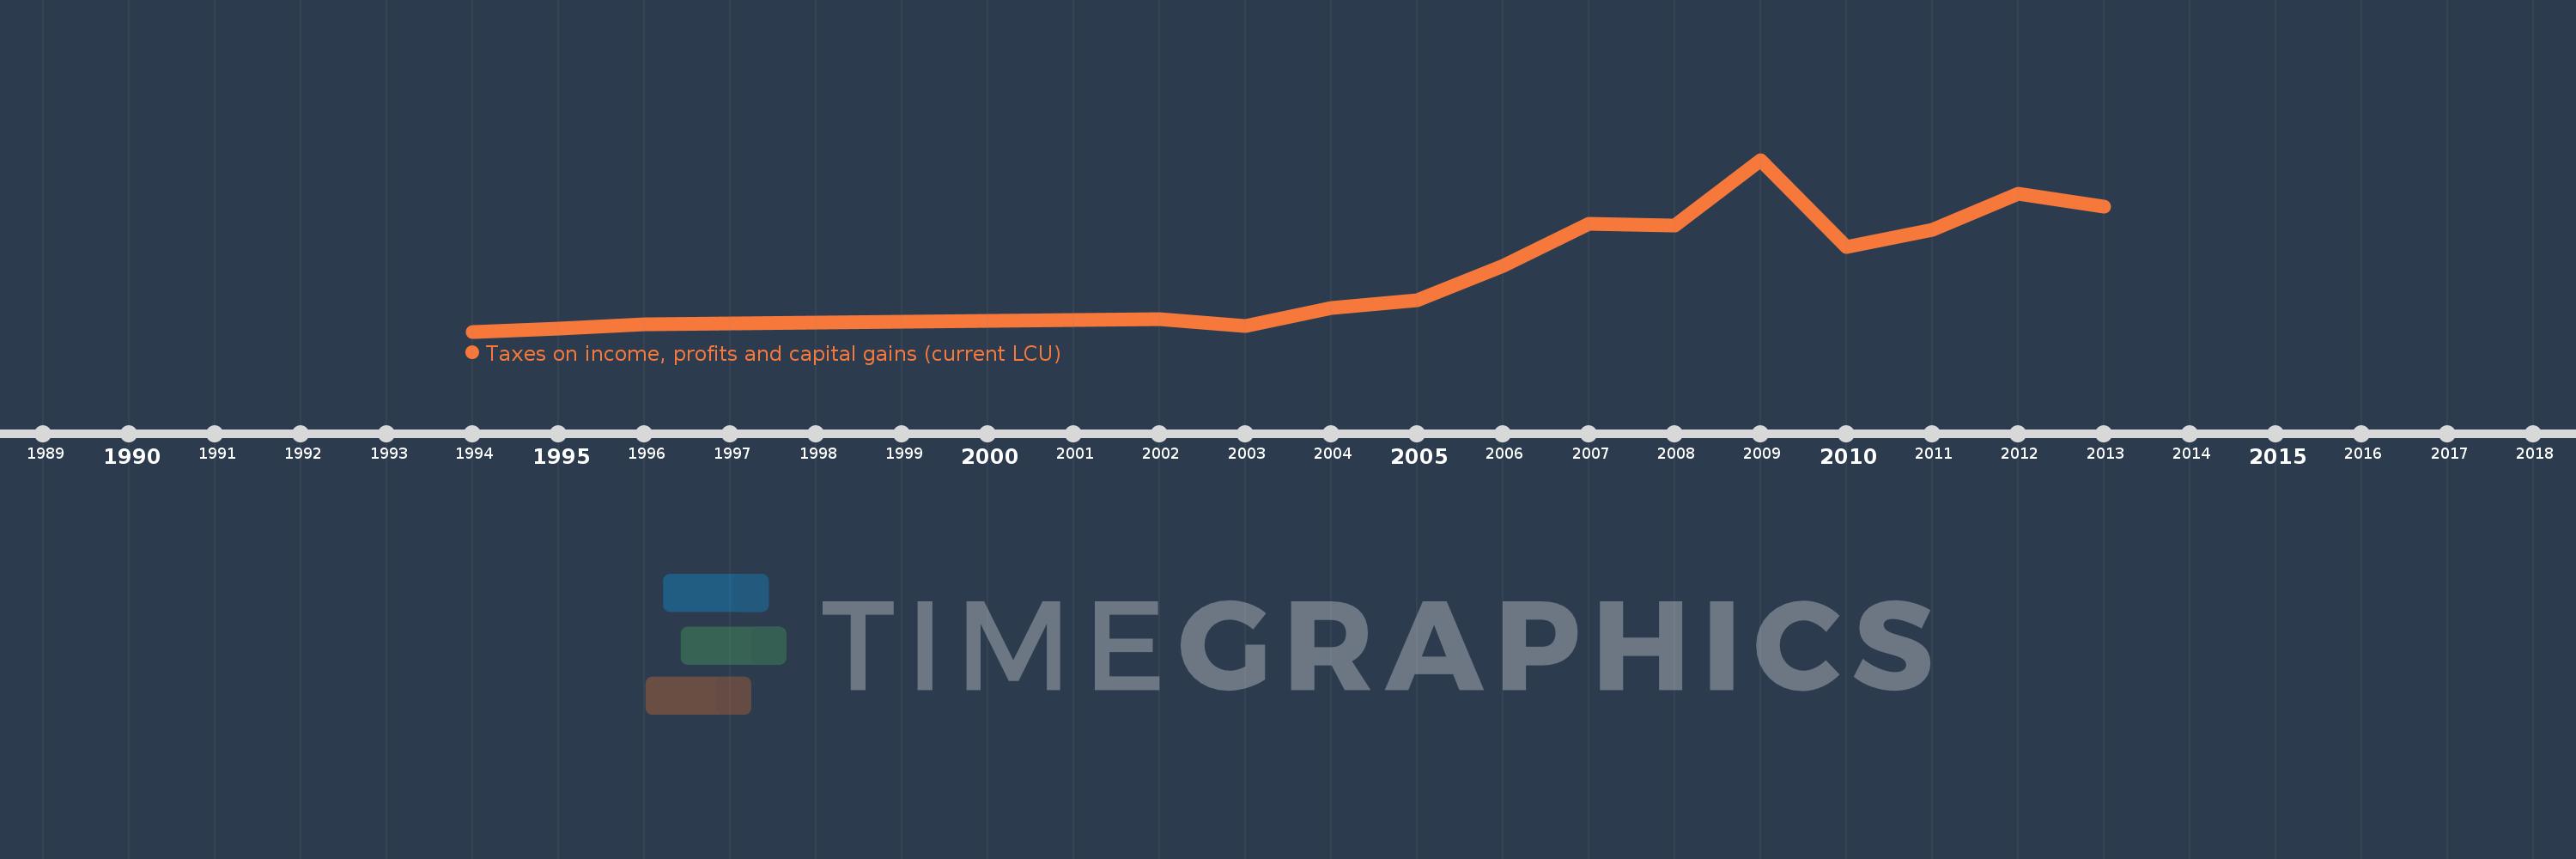
Taxes on income, profits and capital gains (current LCU)
2013,2012,2011,2010,2009,2008,2007,2006,2005,2004,2003,2002,1996,1995,1994
This statistics in other country:
AfghanistanAlbaniaAlgeriaAngolaAntigua and BarbudaArgentinaArmeniaAustraliaAustriaAzerbaijanBahrainBangladeshBarbadosBelarusBelgiumBelizeBeninBhutanBoliviaBosnia and HerzegovinaBotswanaBrazilBulgariaBurkina FasoBurundiCabo VerdeCambodiaCanadaCentral African RepublicChileChinaColombiaCongo, Dem. Rep.Congo, Rep.Costa RicaCote d'IvoireCroatiaCyprusCzech RepublicDenmarkDominicaDominican RepublicEgypt, Arab Rep.El SalvadorEquatorial GuineaEstoniaEthiopiaFijiFinlandFranceGambia, TheGeorgiaGermanyGhanaGreeceGrenadaGuatemalaHondurasHong Kong SAR, ChinaHungaryIcelandIndiaIndonesiaIran, Islamic Rep.IraqIrelandIsraelItalyJamaicaJapanJordanKazakhstanKenyaKiribatiKorea, Rep.KuwaitKyrgyz RepublicLao PDRLatviaLebanonLesothoLiberiaLithuaniaLuxembourgMacao SAR, ChinaMacedonia, FYRMadagascarMalawiMalaysiaMaldivesMaliMaltaMauritiusMexicoMicronesia, Fed. Sts.MoldovaMongoliaMoroccoMozambiqueMyanmarNamibiaNepalNetherlandsNew ZealandNicaraguaNigeriaNorwayOmanPakistanPanamaPapua New GuineaParaguayPeruPhilippinesPolandPortugalQatarRomaniaRussian FederationRwandaSamoaSan MarinoSao Tome and PrincipeSenegalSerbiaSeychellesSierra LeoneSingaporeSlovak RepublicSloveniaSolomon IslandsSouth AfricaSpainSri LankaSt. Kitts and NevisSt. LuciaSurinameSwazilandSwedenSwitzerlandSyrian Arab RepublicTajikistanTanzaniaThailandTimor-LesteTogoTrinidad and TobagoTunisiaTurkeyUgandaUkraineUnited KingdomUnited StatesUruguayVenezuela, RBVietnamWest Bank and GazaYemen, Rep.ZambiaZimbabwe Timeline:
This timeline shows a graph from 1994 to 2013 of Trinidad and Tobago. No data until 1993. Number of actual observations by date: 15.
Source name:
World Development Indicators
Source organization:
International Monetary Fund, Government Finance Statistics Yearbook and data files.
Categories, topics:
Public Sector
Last updated:
apr 23, 2017
Indicators value changes by year
Minimum:
2.849 bln
jan 1, 1994
Maximum:
37.053 bln
jan 1, 2009
At the date of observation
Value
Absolute change
Change from previous value
jan 1, 1994
2.849 bln
+2.849 bln
0.0%
jan 1, 1995
3.374 bln
+525.0 mln
18.43%
jan 1, 1996
4.334 bln
+959.3 mln
28.43%
jan 1, 2002
5.323 bln
+989.1 mln
22.82%
jan 1, 2003
3.911 bln
-1.412 bln
-26.53%
jan 1, 2004
7.49 bln
+3.579 bln
91.53%
jan 1, 2005
9.17 bln
+1.68 bln
22.43%
jan 1, 2006
15.938 bln
+6.768 bln
73.81%
jan 1, 2007
24.31 bln
+8.371 bln
52.52%
jan 1, 2008
23.89 bln
-419.6 mln
-1.73%
jan 1, 2009
37.053 bln
+13.163 bln
55.1%
jan 1, 2010
19.75 bln
-17.302 bln
-46.7%
jan 1, 2011
23.071 bln
+3.321 bln
16.81%
jan 1, 2012
30.226 bln
+7.155 bln
31.01%
jan 1, 2013
27.67 bln
-2.555 bln
-8.45%
Ranking of countries by current statistics by years


Comments: