29
/
en
AIzaSyAYiBZKx7MnpbEhh9jyipgxe19OcubqV5w
April 1, 2024
267057
Trinidad and Tobago
TTO
true
2
1
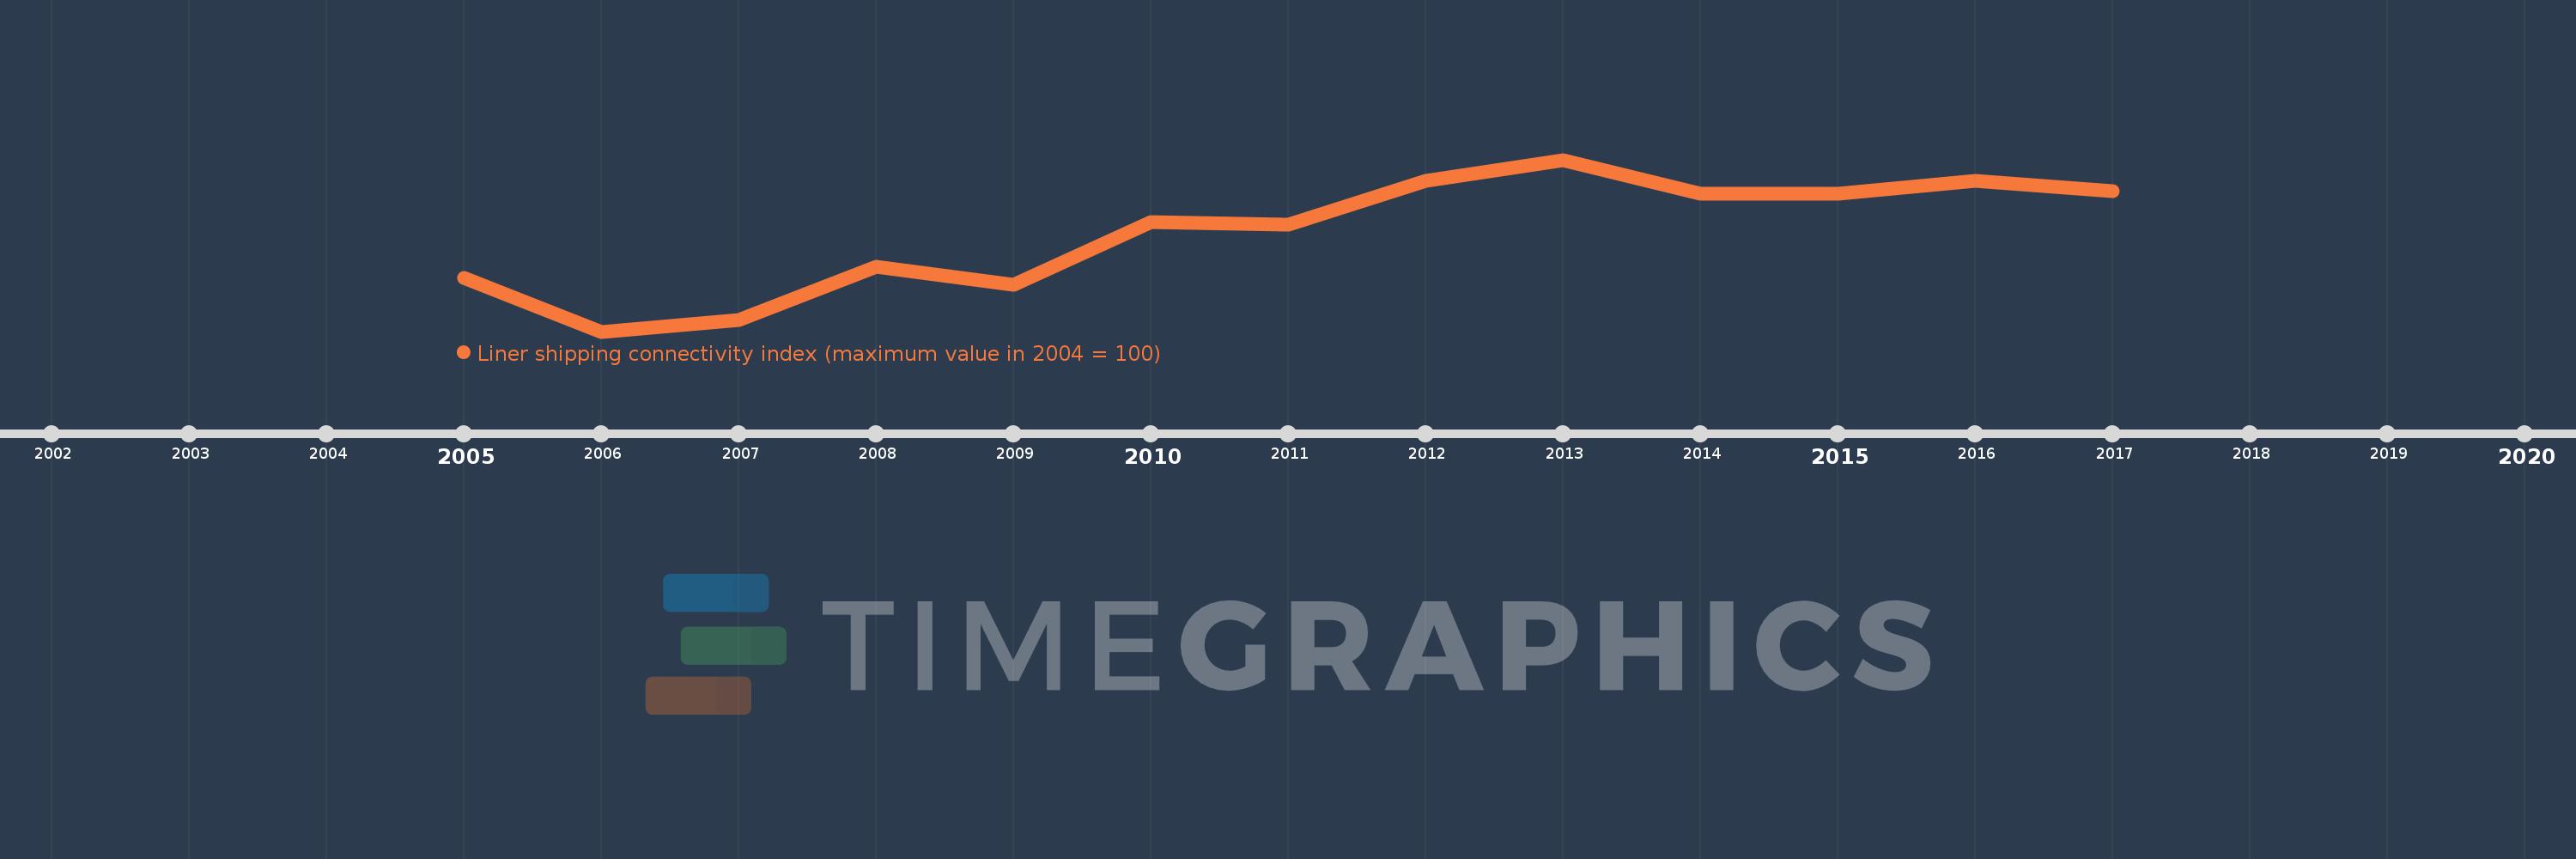
Liner shipping connectivity index (maximum value in 2004 = 100)
2017,2016,2015,2014,2013,2012,2011,2010,2009,2008,2007,2006,2005
This statistics in other country:
AlbaniaAlgeriaAmerican SamoaAngolaAntigua and BarbudaArgentinaArubaAustraliaBahamas, TheBahrainBangladeshBarbadosBelgiumBelizeBeninBermudaBrazilBrunei DarussalamBulgariaCabo VerdeCambodiaCameroonCanadaCayman IslandsChileChinaColombiaComorosCongo, Dem. Rep.Congo, Rep.Costa RicaCote d'IvoireCroatiaCubaCuracaoCyprusDenmarkDjiboutiDominicaDominican RepublicEcuadorEgypt, Arab Rep.El SalvadorEquatorial GuineaEritreaEstoniaFaroe IslandsFijiFinlandFranceFrench PolynesiaGabonGambia, TheGeorgiaGermanyGhanaGreeceGreenlandGrenadaGuamGuatemalaGuineaGuinea-BissauGuyanaHaitiHondurasHong Kong SAR, ChinaIcelandIndiaIndonesiaIran, Islamic Rep.IraqIrelandIsraelItalyJamaicaJapanJordanKenyaKiribatiKorea, Rep.KuwaitLatviaLebanonLiberiaLibyaLithuaniaMadagascarMalaysiaMaldivesMaltaMarshall IslandsMauritaniaMauritiusMexicoMicronesia, Fed. Sts.MontenegroMoroccoMozambiqueMyanmarNamibiaNetherlandsNew CaledoniaNew ZealandNicaraguaNigeriaNorthern Mariana IslandsNorwayOmanPakistanPalauPanamaPapua New GuineaPeruPhilippinesPolandPortugalQatarRomaniaRussian FederationSamoaSao Tome and PrincipeSaudi ArabiaSenegalSerbiaSeychellesSierra LeoneSingaporeSloveniaSolomon IslandsSomaliaSouth AfricaSpainSri LankaSt. Kitts and NevisSt. LuciaSt. Vincent and the GrenadinesSudanSurinameSwedenSyrian Arab RepublicTanzaniaThailandTogoTongaTrinidad and TobagoTunisiaTurkeyUkraineUnited Arab EmiratesUnited KingdomUnited StatesUruguayVanuatuVenezuela, RBVietnamYemen, Rep. Timeline:
This timeline shows a graph from 2005 to 2017 of Trinidad and Tobago. No data until 2004. Number of actual observations by date: 13.
Source name:
World Development Indicators
Source organization:
United Nations Conference on Trade and Development, Review of Maritime Transport 2010.
Categories, topics:
Infrastructure
Last updated:
apr 23, 2017
Indicators value changes by year
At the date of observation
Value
Absolute change
Change from previous value
jan 1, 2005
13.18
+13.18
0.0%
jan 1, 2006
10.61
-2.57
-19.5%
jan 1, 2007
11.18
+0.57
5.37%
jan 1, 2008
13.72
+2.54
22.72%
jan 1, 2009
12.88
-0.84
-6.12%
jan 1, 2010
15.88
+3.0
23.29%
jan 1, 2011
15.76
-0.12
-0.76%
jan 1, 2012
17.89
+2.13
13.52%
jan 1, 2013
18.9
+1.01
5.65%
jan 1, 2014
17.26
-1.64
-8.68%
jan 1, 2015
17.26
0.0
0.0%
jan 1, 2016
17.89
+0.63
3.65%
jan 1, 2017
17.39
-0.5
-2.79%
Ranking of countries by current statistics by years


Comments: