29
/
en
AIzaSyAYiBZKx7MnpbEhh9jyipgxe19OcubqV5w
April 1, 2024
265157
Togo
TGO
true
2
1
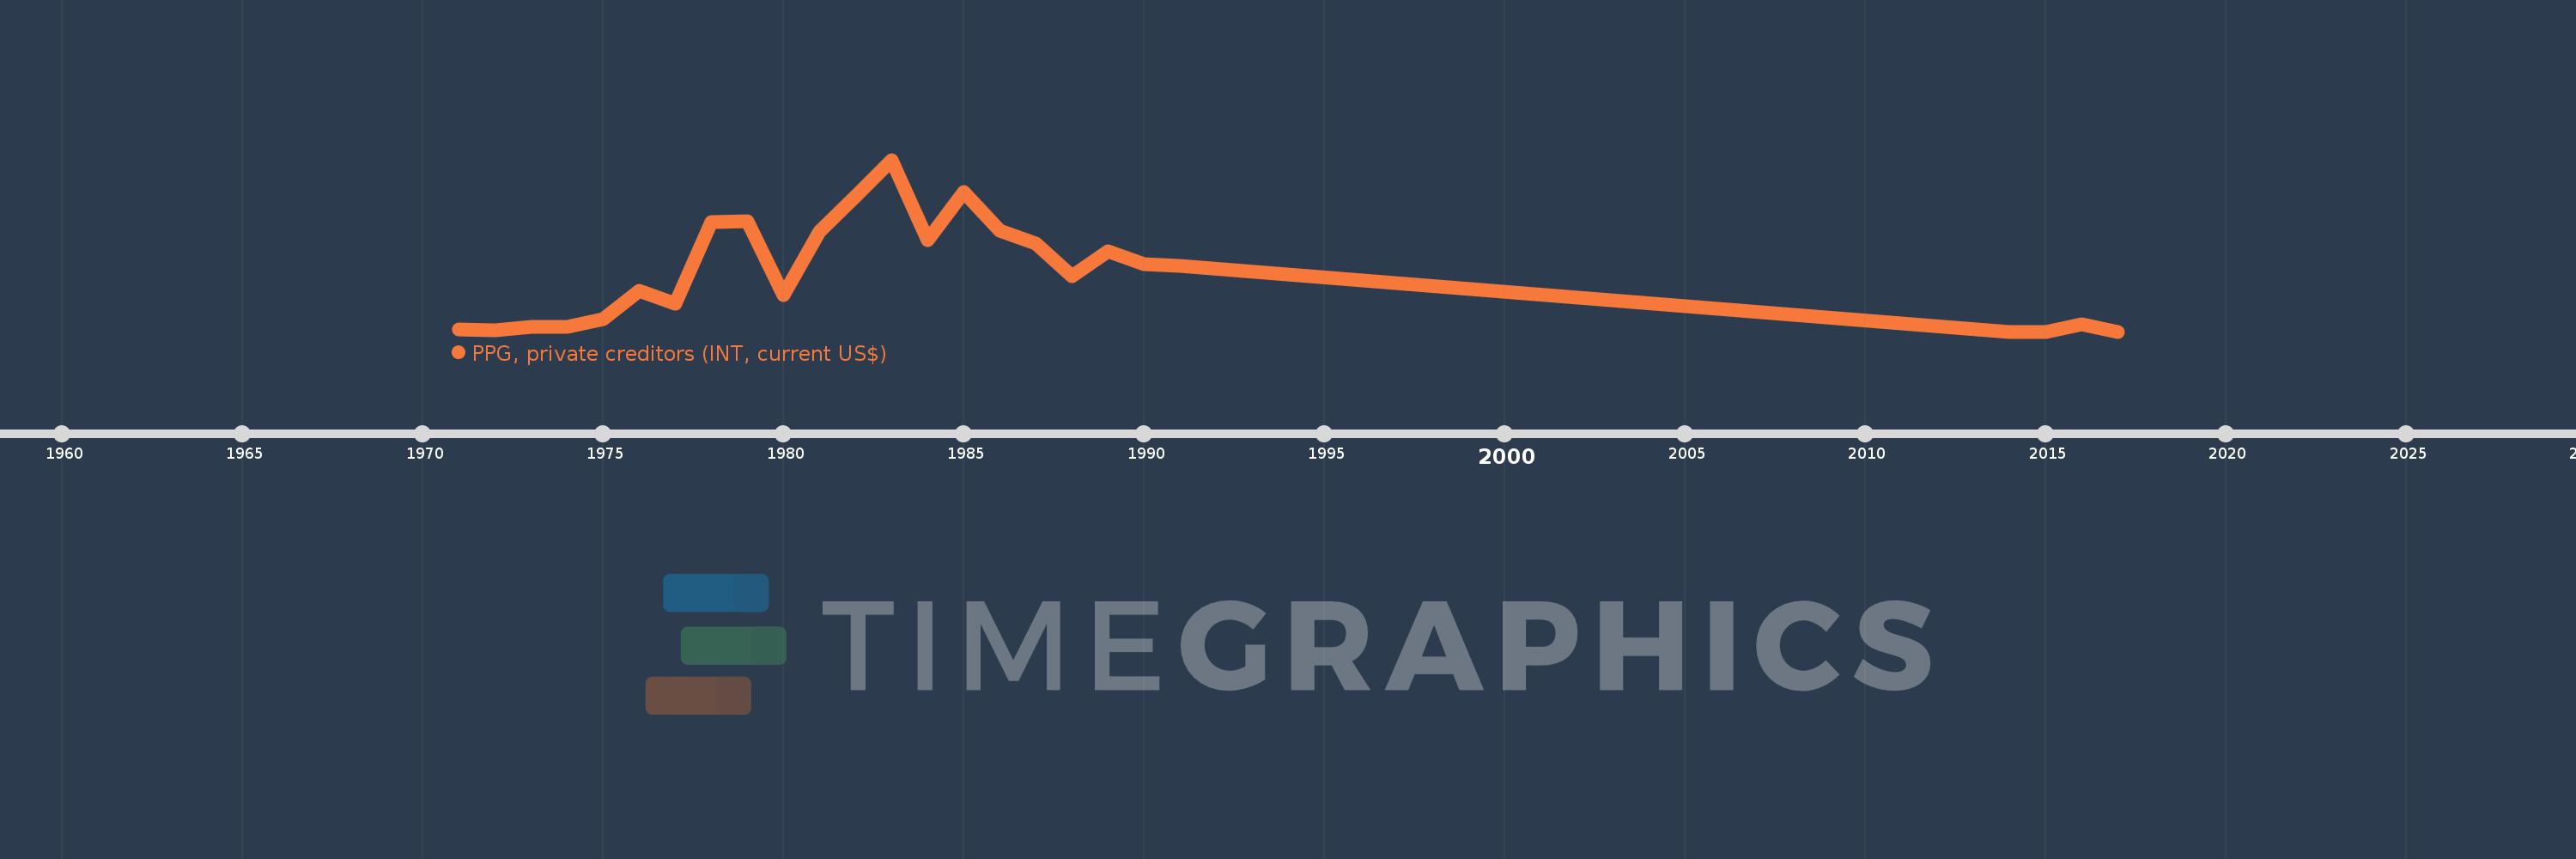
PPG, private creditors (INT, current US$)
2017,2016,2015,2014,1991,1990,1989,1988,1987,1986,1985,1984,1983,1982,1981,1980,1979,1978,1977,1976,1975,1974,1973,1972,1971
This statistics in other country:
Timeline:
This timeline shows a graph from 1971 to 2017 of Togo. No data until 1970. Number of actual observations by date: 25.
Source name:
World Development Indicators
Source organization:
World Bank, International Debt Statistics.
Categories, topics:
External Debt
Last updated:
apr 23, 2017
Indicators value changes by year
Maximum:
13.128 mln
jan 1, 1983
At the date of observation
Value
Absolute change
Change from previous value
jan 1, 1971
153.0K
+153.0K
0.0%
jan 1, 1972
112.0K
-41.0K
-26.8%
jan 1, 1973
334.0K
+222.0K
198.21%
jan 1, 1974
354.0K
+20.0K
5.99%
jan 1, 1975
941.0K
+587.0K
165.82%
jan 1, 1976
3.102 mln
+2.161 mln
229.65%
jan 1, 1977
2.136 mln
-966.0K
-31.14%
jan 1, 1978
8.383 mln
+6.247 mln
292.46%
jan 1, 1979
8.465 mln
+82.0K
0.98%
jan 1, 1980
2.801 mln
-5.664 mln
-66.91%
jan 1, 1981
7.676 mln
+4.875 mln
174.04%
jan 1, 1982
10.315 mln
+2.639 mln
34.38%
jan 1, 1983
13.128 mln
+2.813 mln
27.27%
jan 1, 1984
6.967 mln
-6.161 mln
-46.93%
jan 1, 1985
10.65 mln
+3.683 mln
52.86%
jan 1, 1986
7.701 mln
-2.949 mln
-27.69%
jan 1, 1987
6.739 mln
-962.0K
-12.49%
jan 1, 1988
4.223 mln
-2.516 mln
-37.33%
jan 1, 1989
6.163 mln
+1.94 mln
45.94%
jan 1, 1990
5.141 mln
-1.022 mln
-16.58%
jan 1, 1991
5.007 mln
-134.0K
-2.61%
jan 1, 2014
0.0
-5.007 mln
-100.0%
jan 1, 2016
553.0K
+553.0K
%
jan 1, 2017
0.0
-553.0K
-100.0%
Ranking of countries by current statistics by years


Comments: