29
/
en
AIzaSyAYiBZKx7MnpbEhh9jyipgxe19OcubqV5w
April 1, 2024
26391
Early-demographic dividend
EAR
false
2
1
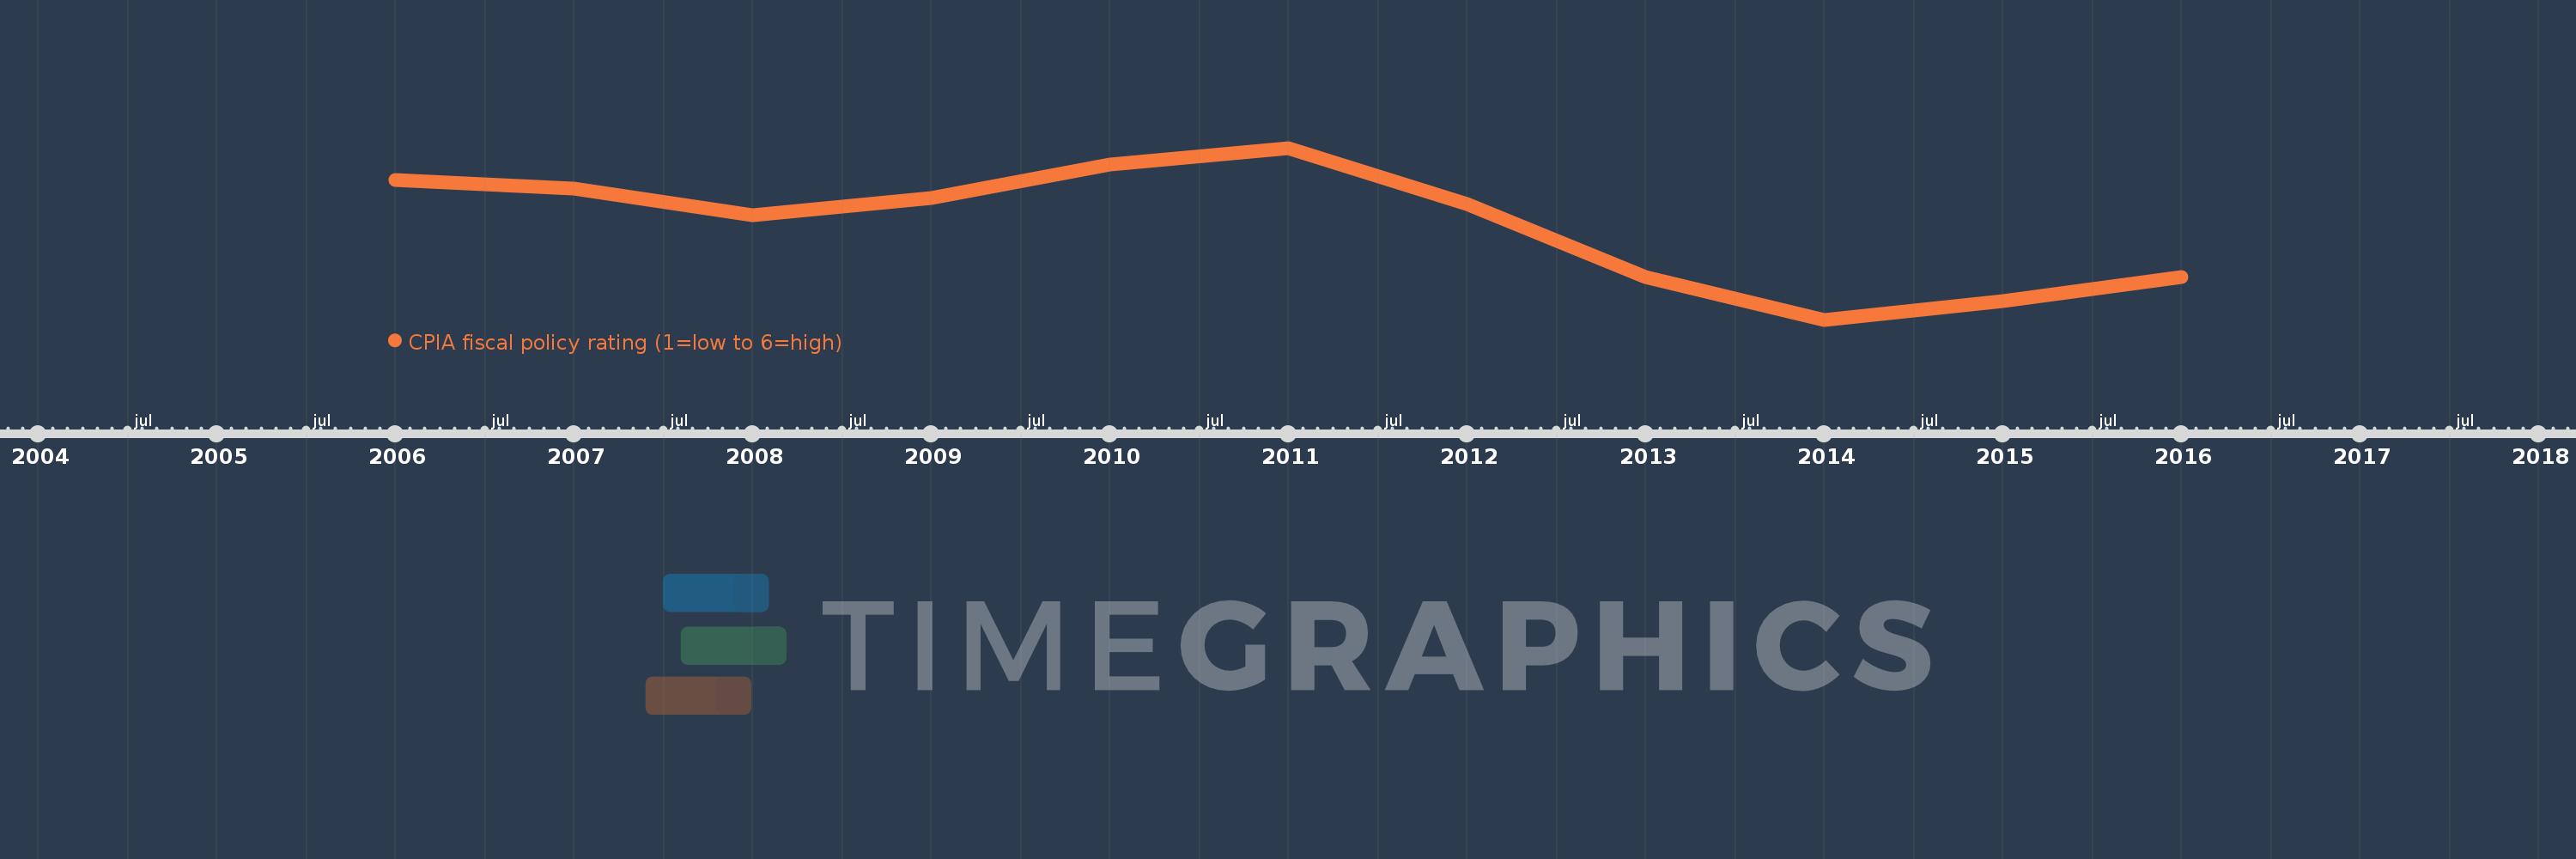
CPIA fiscal policy rating (1=low to 6=high)
2016,2015,2014,2013,2012,2011,2010,2009,2008,2007,2006
This statistics in other country:
Timeline:
This timeline shows a graph from 2006 to 2016 of Early-demographic dividend. No data until 2005. Number of actual observations by date: 11.
Source name:
World Development Indicators
Source organization:
World Bank Group, CPIA database (http://www.worldbank.org/ida).
Categories, topics:
Public Sector
Last updated:
apr 23, 2017
Indicators value changes by year
At the date of observation
Value
Absolute change
Change from previous value
jan 1, 2006
3.417
+3.417
0.0%
jan 1, 2007
3.4
-0.017
-0.49%
jan 1, 2008
3.345
-0.055
-1.62%
jan 1, 2009
3.379
+0.034
1.03%
jan 1, 2010
3.448
+0.069
2.04%
jan 1, 2011
3.483
+0.034
1.0%
jan 1, 2012
3.367
-0.116
-3.33%
jan 1, 2013
3.217
-0.15
-4.46%
jan 1, 2014
3.129
-0.088
-2.72%
jan 1, 2015
3.167
+0.038
1.2%
jan 1, 2016
3.217
+0.05
1.58%
Ranking of countries by current statistics by years


Comments: