29
/
en
AIzaSyAYiBZKx7MnpbEhh9jyipgxe19OcubqV5w
April 1, 2024
262972
Thailand
THA
true
2
1
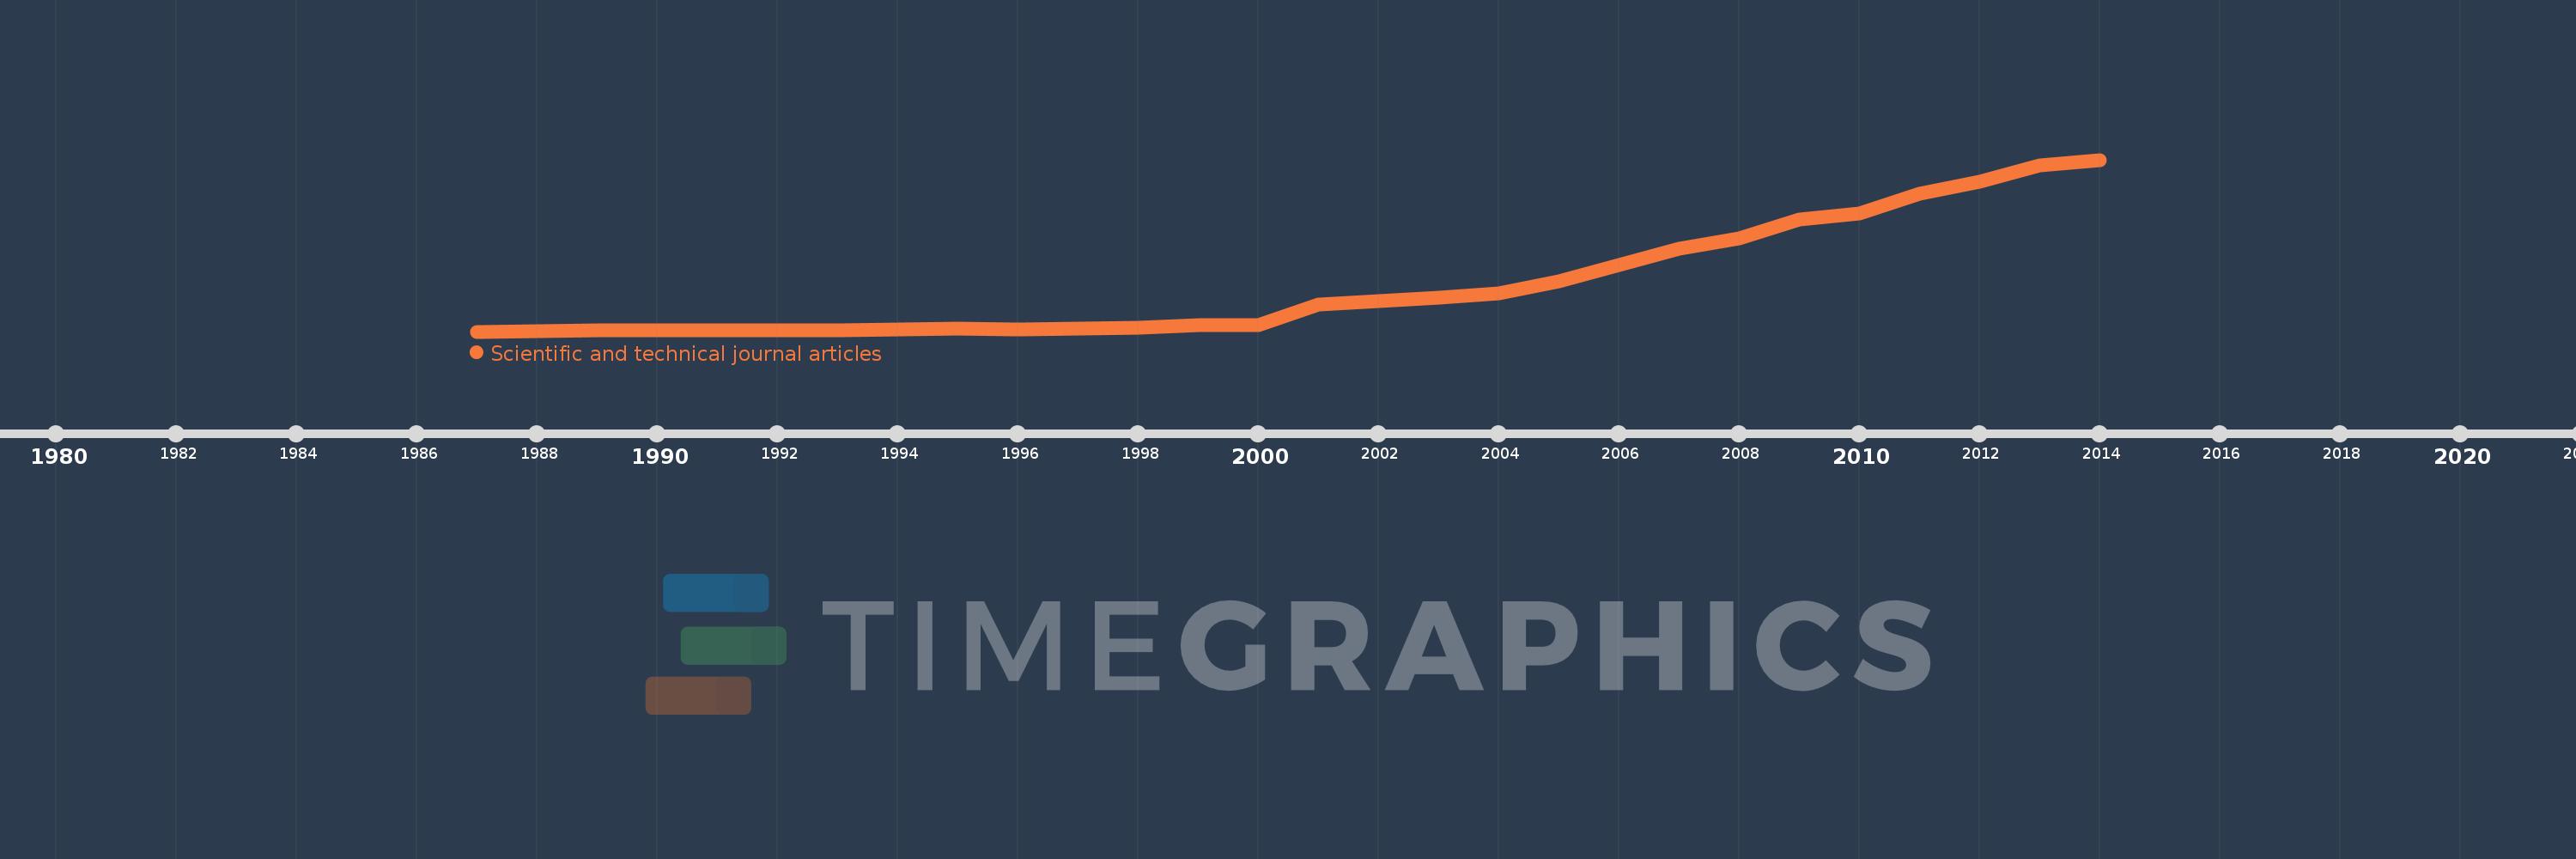
Scientific and technical journal articles
2014,2013,2012,2011,2010,2009,2008,2007,2006,2005,2004,2003,2002,2001,2000,1999,1998,1997,1996,1995,1994,1993,1992,1991,1990,1989,1988,1987
This statistics in other country:
AfghanistanAlbaniaAlgeriaAndorraAngolaAntigua and BarbudaArab WorldArgentinaArmeniaAustraliaAustriaAzerbaijanBahamas, TheBahrainBangladeshBarbadosBelarusBelgiumBelizeBeninBhutanBoliviaBosnia and HerzegovinaBotswanaBrazilBrunei DarussalamBulgariaBurkina FasoBurundiCabo VerdeCambodiaCameroonCanadaCaribbean small statesCentral African RepublicCentral Europe and the BalticsChadChileChinaColombiaComorosCongo, Dem. Rep.Congo, Rep.Costa RicaCote d'IvoireCroatiaCubaCyprusCzech RepublicDenmarkDjiboutiDominicaDominican RepublicEarly-demographic dividendEast Asia & PacificEast Asia & Pacific (excluding high income)East Asia & Pacific (IDA & IBRD countries)EcuadorEgypt, Arab Rep.El SalvadorEquatorial GuineaEritreaEstoniaEthiopiaEuro areaEurope & Central AsiaEurope & Central Asia (excluding high income)Europe & Central Asia (IDA & IBRD countries)European UnionFijiFinlandFragile and conflict affected situationsFranceGabonGambia, TheGeorgiaGermanyGhanaGreeceGrenadaGuatemalaGuineaGuinea-BissauGuyanaHaitiHeavily indebted poor countries (HIPC)High incomeHondurasHong Kong SAR, ChinaHungaryIBRD onlyIcelandIDA & IBRD totalIDA blendIDA onlyIDA totalIndiaIndonesiaIran, Islamic Rep.IraqIrelandIsraelItalyJamaicaJapanJordanKazakhstanKenyaKiribatiKorea, Dem. People’s Rep.Korea, Rep.KosovoKuwaitKyrgyz RepublicLao PDRLate-demographic dividendLatin America & Caribbean Latin America & Caribbean (excluding high income)Latin America & the Caribbean (IDA & IBRD countries)LatviaLeast developed countries: UN classificationLebanonLesothoLiberiaLibyaLiechtensteinLithuaniaLow & middle incomeLow incomeLower middle incomeLuxembourgMacedonia, FYRMadagascarMalawiMalaysiaMaldivesMaliMaltaMarshall IslandsMauritaniaMauritiusMexicoMicronesia, Fed. Sts.Middle East & North AfricaMiddle East & North Africa (excluding high income)Middle East & North Africa (IDA & IBRD countries)Middle incomeMoldovaMonacoMongoliaMontenegroMoroccoMozambiqueMyanmarNamibiaNauruNepalNetherlandsNew ZealandNicaraguaNigerNigeriaNorth AmericaNorwayOECD membersOmanOther small statesPacific island small statesPakistanPalauPanamaPapua New GuineaParaguayPeruPhilippinesPolandPortugalPost-demographic dividendPre-demographic dividendQatarRomaniaRussian FederationRwandaSamoaSan MarinoSao Tome and PrincipeSaudi ArabiaSenegalSerbiaSeychellesSierra LeoneSingaporeSlovak RepublicSloveniaSmall statesSolomon IslandsSomaliaSouth AfricaSouth AsiaSouth Asia (IDA & IBRD)SpainSri LankaSt. Kitts and NevisSt. LuciaSt. Vincent and the GrenadinesSub-Saharan Africa Sub-Saharan Africa (excluding high income)Sub-Saharan Africa (IDA & IBRD countries)SudanSurinameSwazilandSwedenSwitzerlandSyrian Arab RepublicTajikistanTanzaniaThailandTogoTongaTrinidad and TobagoTunisiaTurkeyTurkmenistanTuvaluUgandaUkraineUnited Arab EmiratesUnited KingdomUnited StatesUpper middle incomeUruguayUzbekistanVanuatuVenezuela, RBVietnamWest Bank and GazaWorldYemen, Rep.ZambiaZimbabwe Timeline:
This timeline shows a graph from 1987 to 2014 of Thailand. No data until 1986. Number of actual observations by date: 28.
Source name:
World Development Indicators
Source organization:
National Science Foundation, Science and Engineering Indicators.
Categories, topics:
Science & Technology
Last updated:
apr 23, 2017
Indicators value changes by year
Maximum:
8.631K
jan 1, 2014
At the date of observation
Value
Absolute change
Change from previous value
jan 1, 1987
226.0
+226.0
0.0%
jan 1, 1988
235.0
+9.0
3.98%
jan 1, 1989
287.0
+52.0
22.13%
jan 1, 1990
272.0
-15.0
-5.23%
jan 1, 1991
282.0
+10.0
3.68%
jan 1, 1992
298.0
+16.0
5.67%
jan 1, 1993
300.0
+2.0
0.67%
jan 1, 1994
317.0
+17.0
5.67%
jan 1, 1995
383.0
+66.0
20.82%
jan 1, 1996
339.6
-43.4
-11.33%
jan 1, 1997
386.6
+47.0
13.84%
jan 1, 1998
405.3
+18.7
4.84%
jan 1, 1999
540.8
+135.5
33.43%
jan 1, 2000
549.5
+8.7
1.61%
jan 1, 2001
1.548K
+999.0
181.8%
jan 1, 2002
1.715K
+166.2
10.73%
jan 1, 2003
1.877K
+162.3
9.47%
jan 1, 2004
2.105K
+227.6
12.13%
jan 1, 2005
2.688K
+583.1
27.71%
jan 1, 2006
3.498K
+810.6
30.16%
jan 1, 2007
4.271K
+772.7
22.09%
jan 1, 2008
4.788K
+517.1
12.11%
jan 1, 2009
5.709K
+921.0
19.24%
jan 1, 2010
5.989K
+280.0
4.9%
jan 1, 2011
6.966K
+977.1
16.31%
jan 1, 2012
7.553K
+587.1
8.43%
jan 1, 2013
8.365K
+811.4
10.74%
jan 1, 2014
8.631K
+266.1
3.18%
Ranking of countries by current statistics by years


Comments: