29
/
en
AIzaSyAYiBZKx7MnpbEhh9jyipgxe19OcubqV5w
April 1, 2024
262722
Thailand
THA
true
2
1
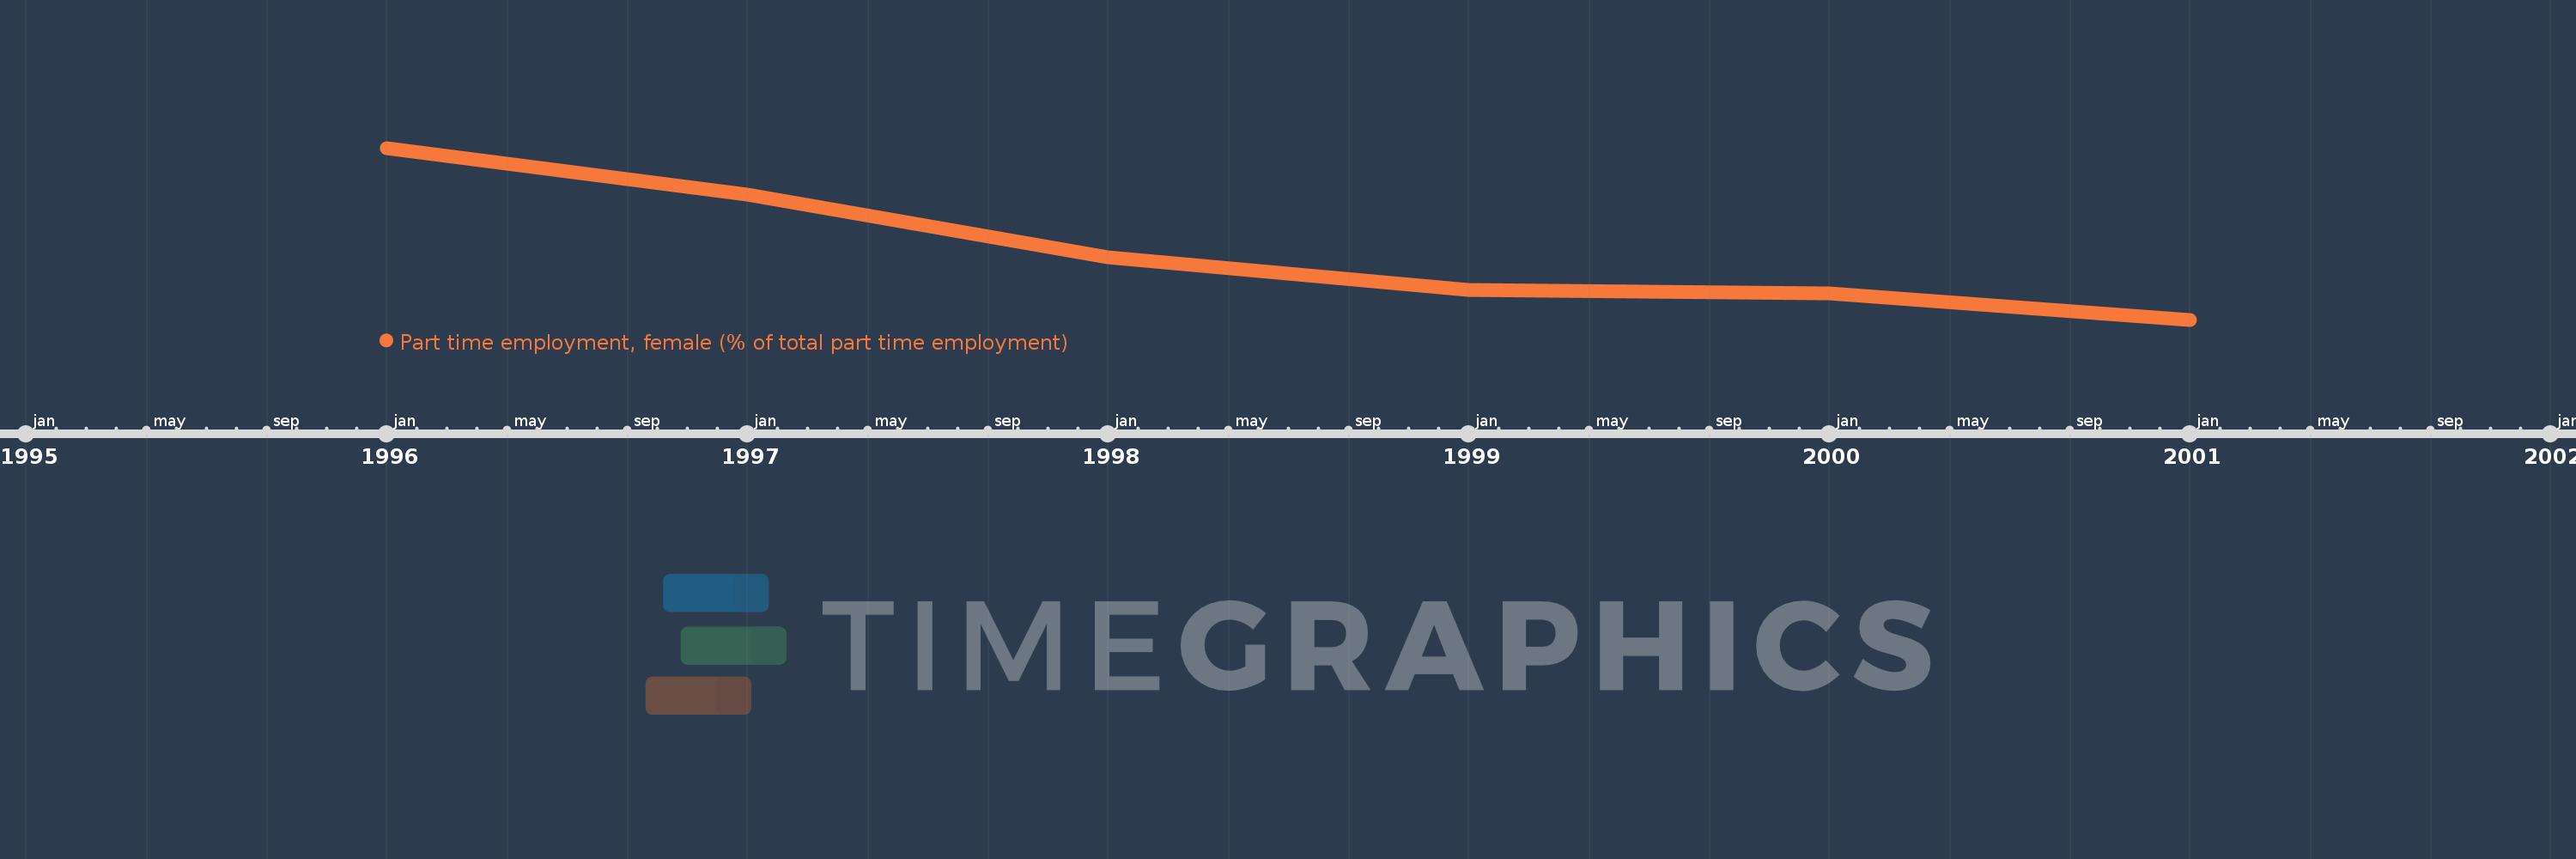
Part time employment, female (% of total part time employment)
2001,2000,1999,1998,1997,1996
This statistics in other country:
Timeline:
This timeline shows a graph from 1996 to 2001 of Thailand. No data until 1995. Number of actual observations by date: 6.
Source name:
World Development Indicators
Source organization:
International Labour Organization, Key Indicators of the Labour Market database.
Categories, topics:
Social Protection & Labor, Gender
Last updated:
apr 23, 2017
Indicators value changes by year
At the date of observation
Value
Absolute change
Change from previous value
jan 1, 1996
53.8
+53.8
0.0%
jan 1, 1997
52.4
-1.4
-2.6%
jan 1, 1998
50.5
-1.9
-3.63%
jan 1, 1999
49.5
-1.0
-1.98%
jan 1, 2000
49.4
-0.1
-0.2%
jan 1, 2001
48.6
-0.8
-1.62%
Ranking of countries by current statistics by years


Comments: