29
/
en
AIzaSyAYiBZKx7MnpbEhh9jyipgxe19OcubqV5w
April 1, 2024
261678
Tanzania
TZA
true
2
1
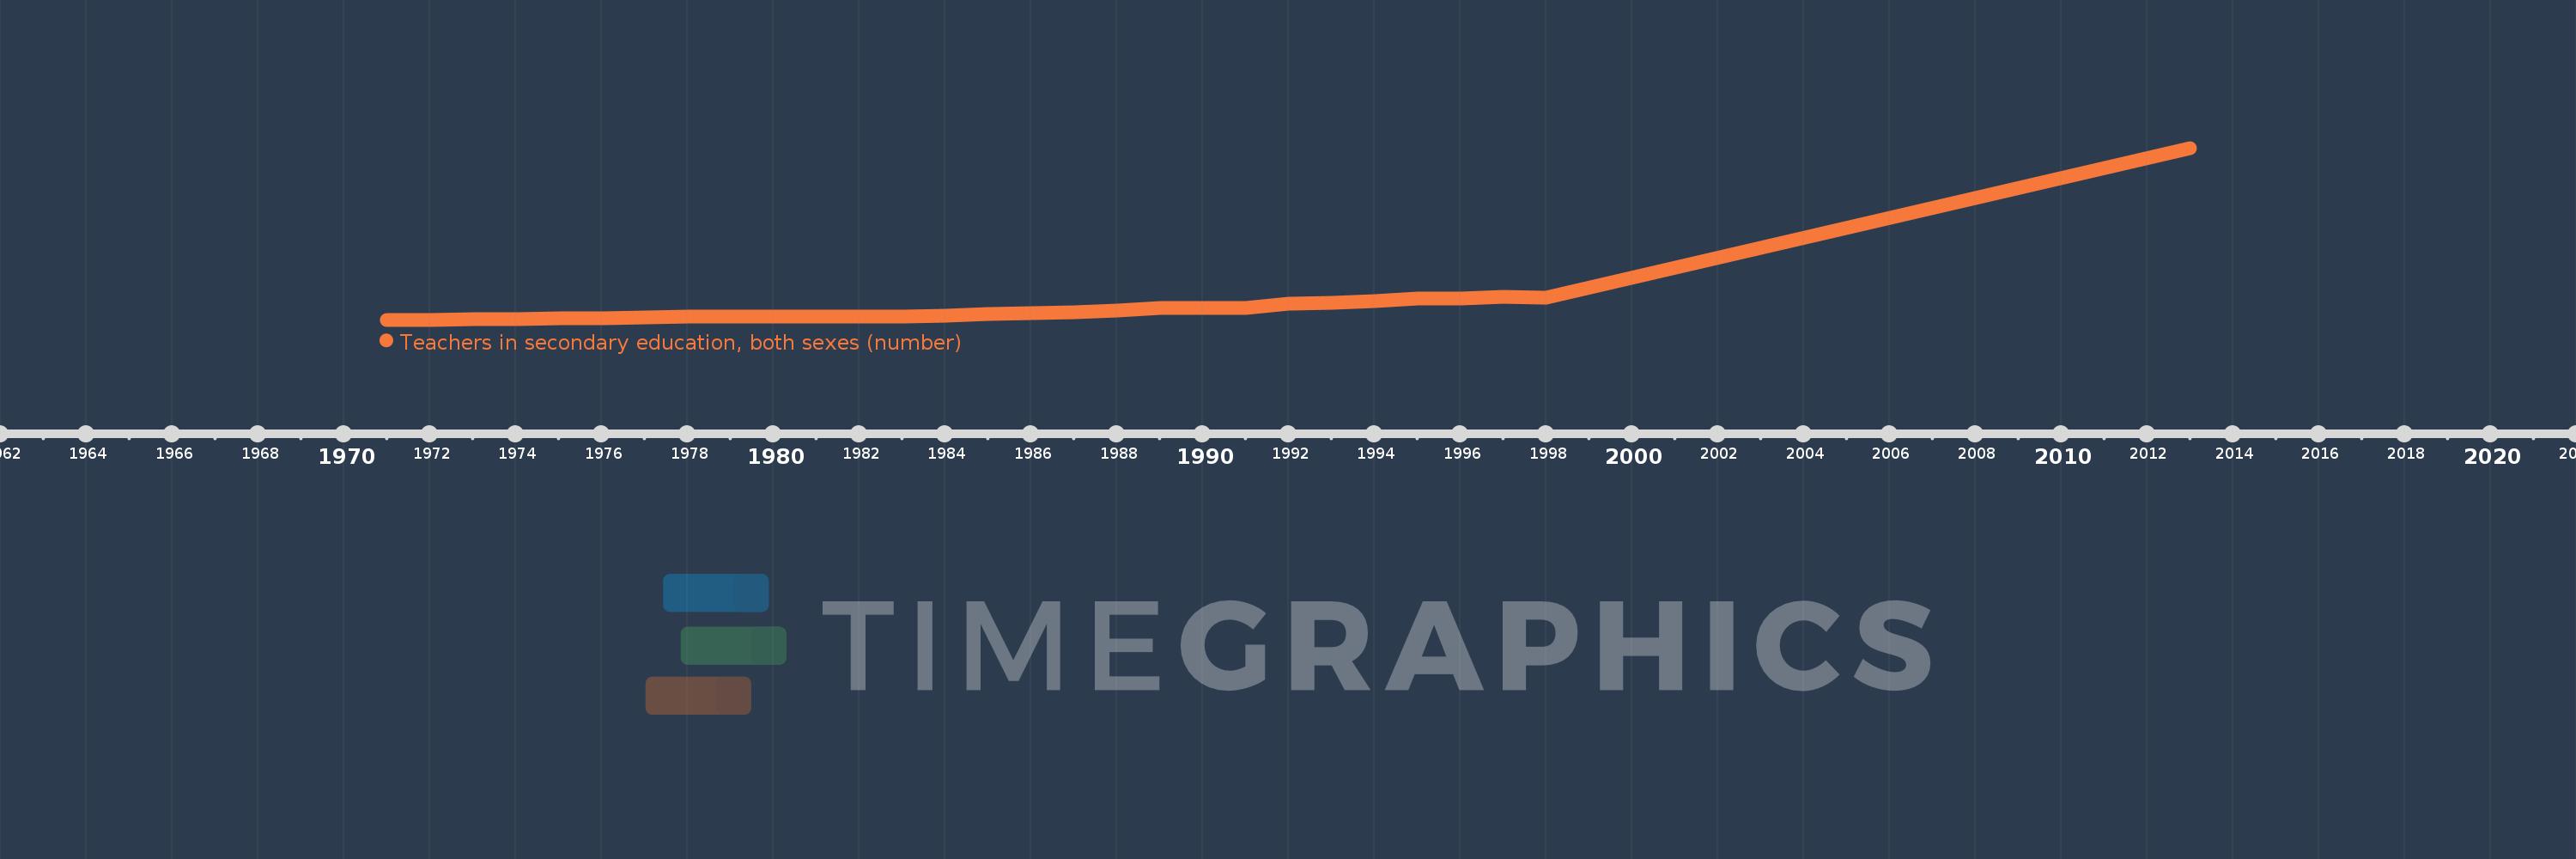
Teachers in secondary education, both sexes (number)
2013,1998,1997,1996,1995,1994,1993,1992,1991,1990,1989,1988,1987,1986,1985,1984,1983,1982,1981,1980,1979,1978,1977,1976,1975,1974,1973,1972,1971
This statistics in other country:
AfghanistanAlbaniaAlgeriaAmerican SamoaAndorraAngolaAntigua and BarbudaArab WorldArgentinaArmeniaArubaAustraliaAustriaBahamas, TheBahrainBangladeshBarbadosBelarusBelgiumBelizeBeninBermudaBhutanBoliviaBosnia and HerzegovinaBotswanaBrazilBritish Virgin IslandsBrunei DarussalamBulgariaBurkina FasoBurundiCabo VerdeCambodiaCameroonCanadaCaribbean small statesCayman IslandsCentral African RepublicCentral Europe and the BalticsChadChileChinaColombiaComorosCongo, Dem. Rep.Congo, Rep.Costa RicaCote d'IvoireCroatiaCubaCyprusCzech RepublicDenmarkDjiboutiDominicaDominican RepublicEarly-demographic dividendEast Asia & PacificEast Asia & Pacific (excluding high income)East Asia & Pacific (IDA & IBRD countries)EcuadorEgypt, Arab Rep.El SalvadorEquatorial GuineaEritreaEstoniaEthiopiaEuro areaEurope & Central AsiaEurope & Central Asia (excluding high income)Europe & Central Asia (IDA & IBRD countries)European UnionFijiFinlandFragile and conflict affected situationsFranceFrench PolynesiaGabonGambia, TheGeorgiaGermanyGhanaGibraltarGreeceGrenadaGuamGuatemalaGuineaGuinea-BissauGuyanaHaitiHeavily indebted poor countries (HIPC)High incomeHondurasHong Kong SAR, ChinaHungaryIBRD onlyIcelandIDA & IBRD totalIDA blendIDA onlyIDA totalIndiaIndonesiaIran, Islamic Rep.IraqIrelandIsraelItalyJamaicaJapanJordanKazakhstanKenyaKiribatiKorea, Dem. People’s Rep.Korea, Rep.KuwaitKyrgyz RepublicLao PDRLate-demographic dividendLatin America & Caribbean Latin America & Caribbean (excluding high income)Latin America & the Caribbean (IDA & IBRD countries)LatviaLeast developed countries: UN classificationLebanonLesothoLiberiaLibyaLiechtensteinLithuaniaLow & middle incomeLow incomeLower middle incomeLuxembourgMacao SAR, ChinaMacedonia, FYRMadagascarMalawiMalaysiaMaldivesMaliMaltaMarshall IslandsMauritaniaMauritiusMexicoMiddle East & North AfricaMiddle East & North Africa (excluding high income)Middle East & North Africa (IDA & IBRD countries)Middle incomeMoldovaMonacoMongoliaMoroccoMozambiqueMyanmarNamibiaNauruNepalNetherlandsNew CaledoniaNew ZealandNicaraguaNigerNigeriaNorth AmericaNorwayOECD membersOmanOther small statesPacific island small statesPakistanPalauPanamaPapua New GuineaParaguayPeruPhilippinesPolandPortugalPost-demographic dividendPre-demographic dividendPuerto RicoQatarRomaniaRussian FederationRwandaSamoaSan MarinoSao Tome and PrincipeSaudi ArabiaSenegalSerbiaSeychellesSierra LeoneSingaporeSint Maarten (Dutch part)Slovak RepublicSloveniaSmall statesSolomon IslandsSomaliaSouth AfricaSouth AsiaSouth Asia (IDA & IBRD)SpainSri LankaSt. Kitts and NevisSt. LuciaSt. Vincent and the GrenadinesSub-Saharan Africa Sub-Saharan Africa (excluding high income)Sub-Saharan Africa (IDA & IBRD countries)SudanSurinameSwazilandSwedenSwitzerlandSyrian Arab RepublicTajikistanTanzaniaThailandTimor-LesteTogoTongaTrinidad and TobagoTunisiaTurkeyTurks and Caicos IslandsUgandaUkraineUnited Arab EmiratesUnited KingdomUnited StatesUpper middle incomeUruguayUzbekistanVanuatuVenezuela, RBVietnamVirgin Islands (U.S.)West Bank and GazaWorldYemen, Rep.ZambiaZimbabwe Timeline:
This timeline shows a graph from 1971 to 2013 of Tanzania. No data until 1970. Number of actual observations by date: 29.
Source name:
World Development Indicators
Source organization:
UNESCO Institute for Statistics
Categories, topics:
Education
Last updated:
apr 23, 2017
Indicators value changes by year
Minimum:
2.449K
jan 1, 1971
Maximum:
80.25K
jan 1, 2013
At the date of observation
Value
Absolute change
Change from previous value
jan 1, 1971
2.449K
+2.449K
0.0%
jan 1, 1972
2.516K
+67.0
2.74%
jan 1, 1973
2.659K
+143.0
5.68%
jan 1, 1974
2.596K
-63.0
-2.37%
jan 1, 1975
2.967K
+371.0
14.29%
jan 1, 1976
3.218K
+251.0
8.46%
jan 1, 1977
3.557K
+339.0
10.53%
jan 1, 1978
3.714K
+157.0
4.41%
jan 1, 1979
3.985K
+271.0
7.3%
jan 1, 1980
4.038K
+53.0
1.33%
jan 1, 1981
3.837K
-201.0
-4.98%
jan 1, 1982
3.843K
+6.0
0.16%
jan 1, 1983
3.989K
+146.0
3.8%
jan 1, 1984
4.453K
+464.0
11.63%
jan 1, 1985
4.886K
+433.0
9.72%
jan 1, 1986
5.267K
+381.0
7.8%
jan 1, 1987
5.917K
+650.0
12.34%
jan 1, 1988
6.678K
+761.0
12.86%
jan 1, 1989
7.649K
+971.0
14.54%
jan 1, 1990
7.863K
+214.0
2.8%
jan 1, 1991
7.944K
+81.0
1.03%
jan 1, 1992
9.904K
+1.96K
24.67%
jan 1, 1993
10.251K
+347.0
3.5%
jan 1, 1994
10.735K
+484.0
4.72%
jan 1, 1995
11.956K
+1.221K
11.37%
jan 1, 1996
12.198K
+242.0
2.02%
jan 1, 1997
12.751K
+553.0
4.53%
jan 1, 1998
12.496K
-255.0
-2.0%
jan 1, 2013
80.25K
+67.754K
542.21%
Ranking of countries by current statistics by years


Comments: