29
/
en
AIzaSyAYiBZKx7MnpbEhh9jyipgxe19OcubqV5w
April 1, 2024
26142
Central Europe and the Baltics
CEB
false
2
1
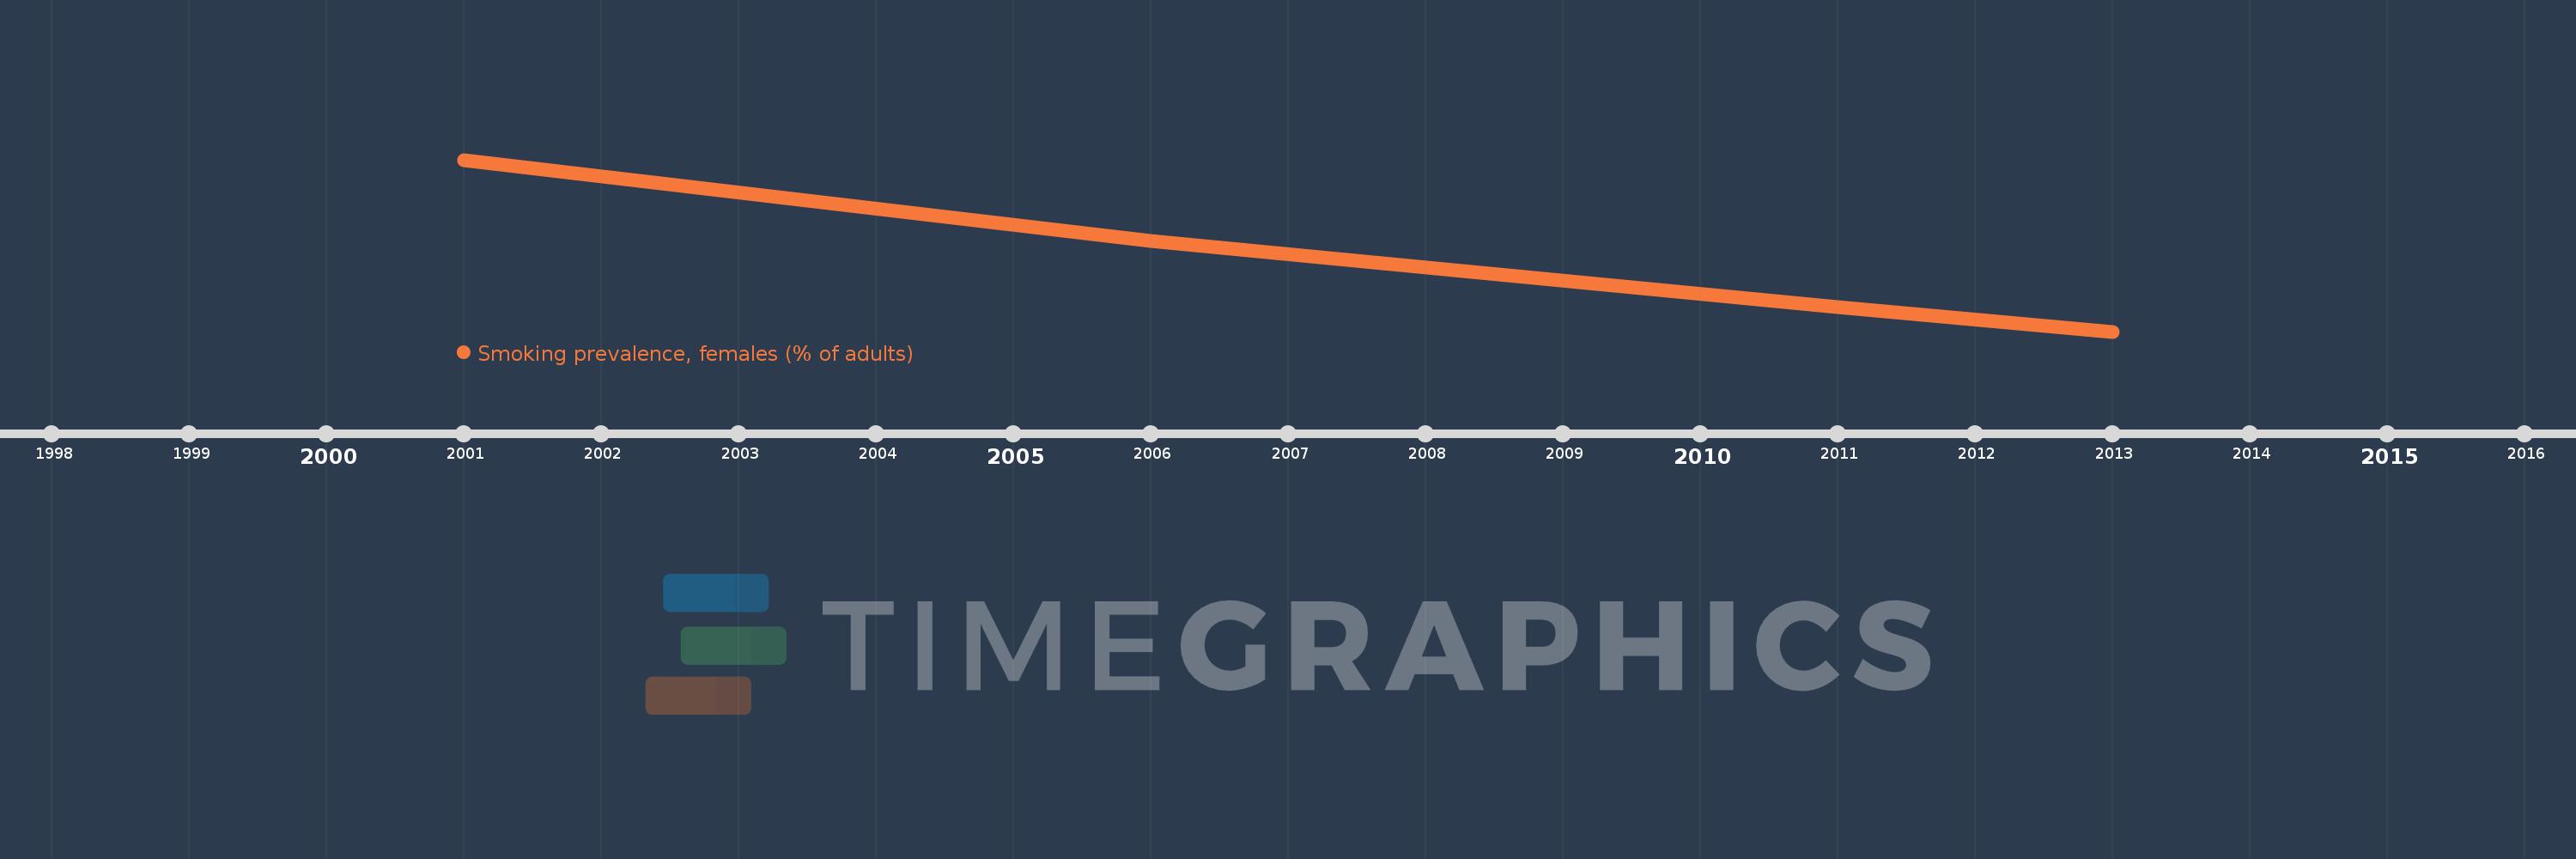
Smoking prevalence, females (% of adults)
2013,2011,2006,2001
This statistics in other country:
Timeline:
This timeline shows a graph from 2001 to 2013 of Central Europe and the Baltics. No data until 2000. Number of actual observations by date: 4.
Source name:
World Development Indicators
Source organization:
World Health Organization, Global Health Observatory Data Repository (http://apps.who.int/ghodata/).
Categories, topics:
Health, Gender
Last updated:
apr 23, 2017
Indicators value changes by year
Minimum:
25.707
jan 1, 2013
At the date of observation
Value
Absolute change
Change from previous value
jan 1, 2001
32.45
+32.45
0.0%
jan 1, 2006
29.268
-3.183
-9.81%
jan 1, 2011
26.655
-2.613
-8.93%
jan 1, 2013
25.707
-0.948
-3.55%
Ranking of countries by current statistics by years


Comments: