29
/
en
AIzaSyAYiBZKx7MnpbEhh9jyipgxe19OcubqV5w
April 1, 2024
26017
Central Europe and the Baltics
CEB
false
2
1
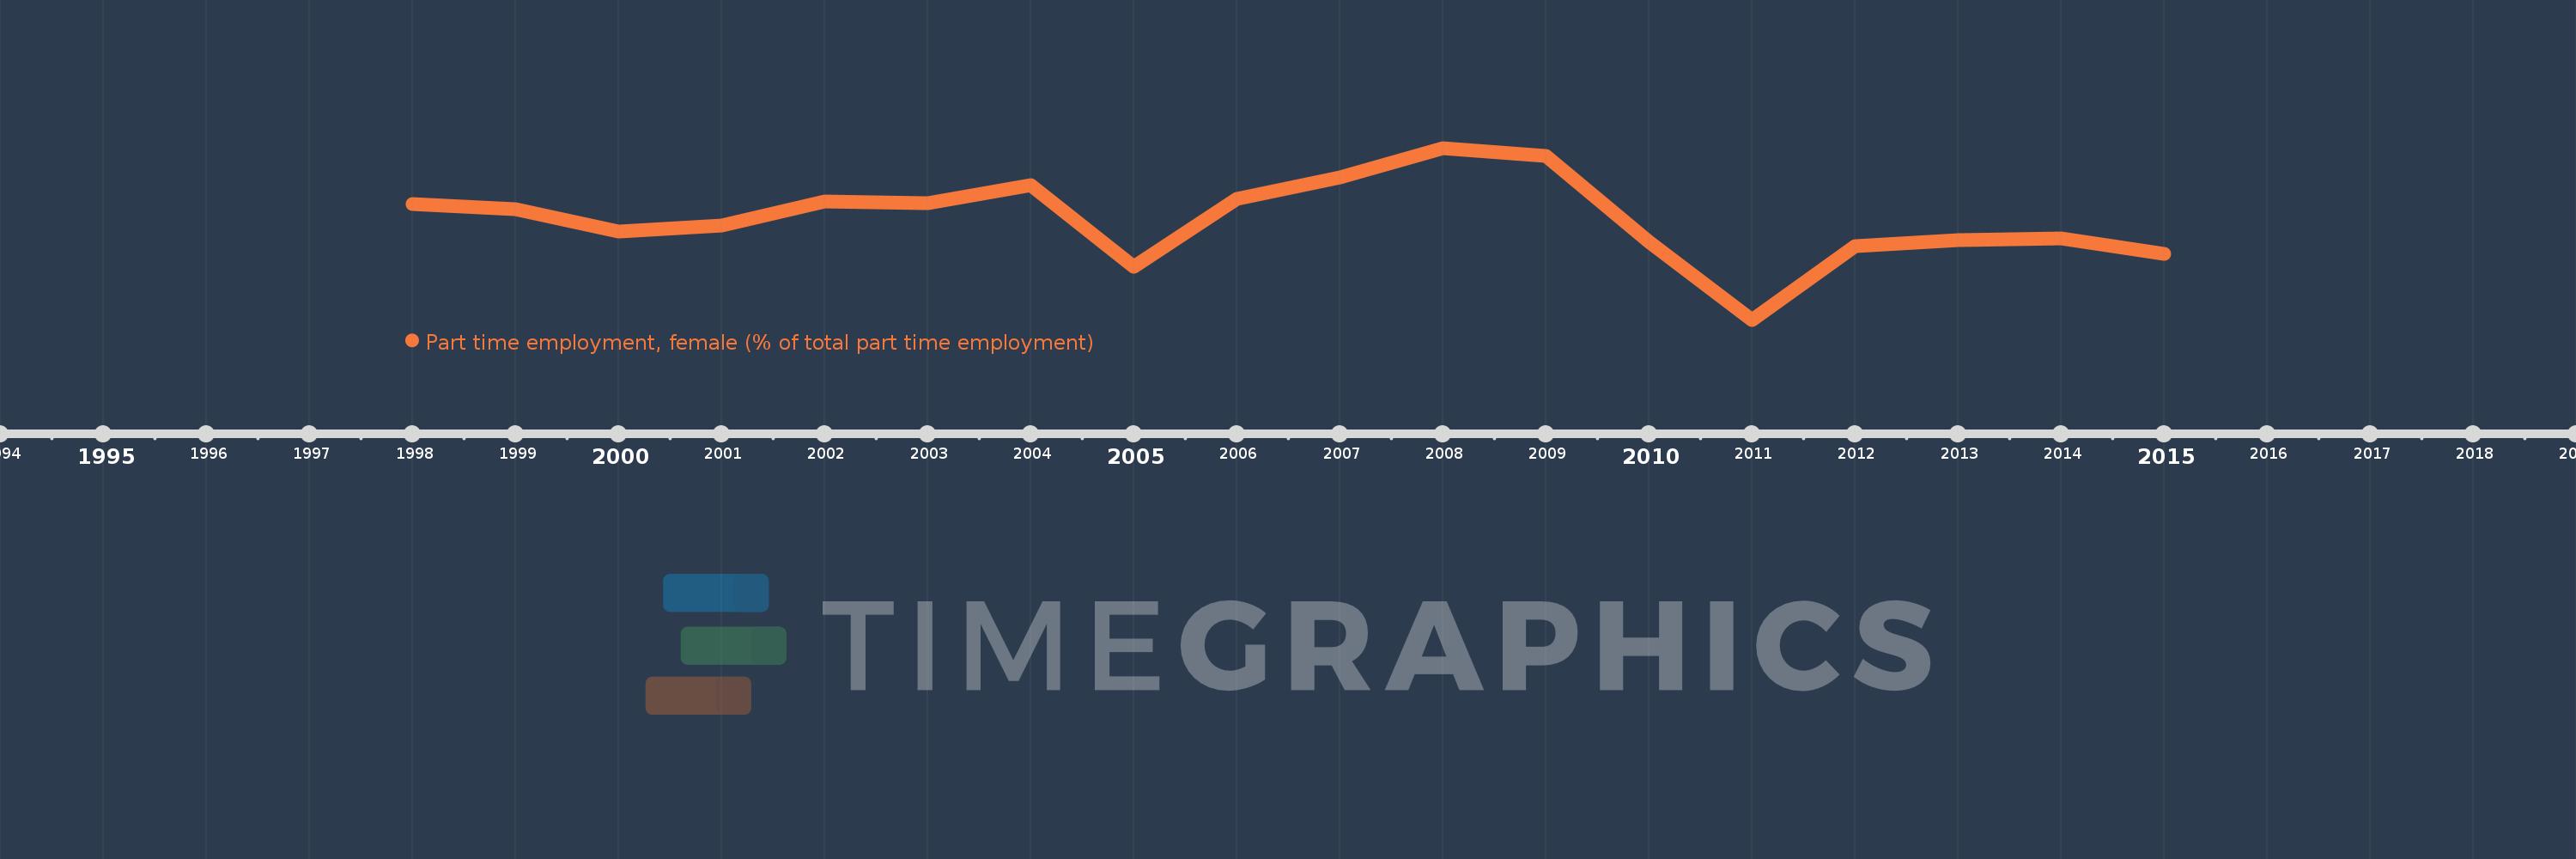
Part time employment, female (% of total part time employment)
2015,2014,2013,2012,2011,2010,2009,2008,2007,2006,2005,2004,2003,2002,2001,2000,1999,1998
This statistics in other country:
Timeline:
This timeline shows a graph from 1998 to 2015 of Central Europe and the Baltics. No data until 1997. Number of actual observations by date: 18.
Source name:
World Development Indicators
Source organization:
International Labour Organization, Key Indicators of the Labour Market database.
Categories, topics:
Social Protection & Labor, Gender
Last updated:
apr 23, 2017
Indicators value changes by year
Minimum:
60.648
jan 1, 2011
Maximum:
62.696
jan 1, 2008
At the date of observation
Value
Absolute change
Change from previous value
jan 1, 1998
62.03
+62.03
0.0%
jan 1, 1999
61.961
-0.069
-0.11%
jan 1, 2000
61.697
-0.264
-0.43%
jan 1, 2001
61.768
+0.071
0.11%
jan 1, 2002
62.053
+0.285
0.46%
jan 1, 2003
62.041
-0.012
-0.02%
jan 1, 2004
62.248
+0.207
0.33%
jan 1, 2005
61.279
-0.969
-1.56%
jan 1, 2006
62.088
+0.809
1.32%
jan 1, 2007
62.349
+0.261
0.42%
jan 1, 2008
62.696
+0.347
0.56%
jan 1, 2009
62.597
-0.099
-0.16%
jan 1, 2010
61.578
-1.019
-1.63%
jan 1, 2011
60.648
-0.93
-1.51%
jan 1, 2012
61.527
+0.879
1.45%
jan 1, 2013
61.597
+0.07
0.11%
jan 1, 2014
61.617
+0.02
0.03%
jan 1, 2015
61.432
-0.185
-0.3%
Ranking of countries by current statistics by years


Comments: