29
/
en
AIzaSyAYiBZKx7MnpbEhh9jyipgxe19OcubqV5w
April 1, 2024
259952
Tajikistan
TJK
true
2
1
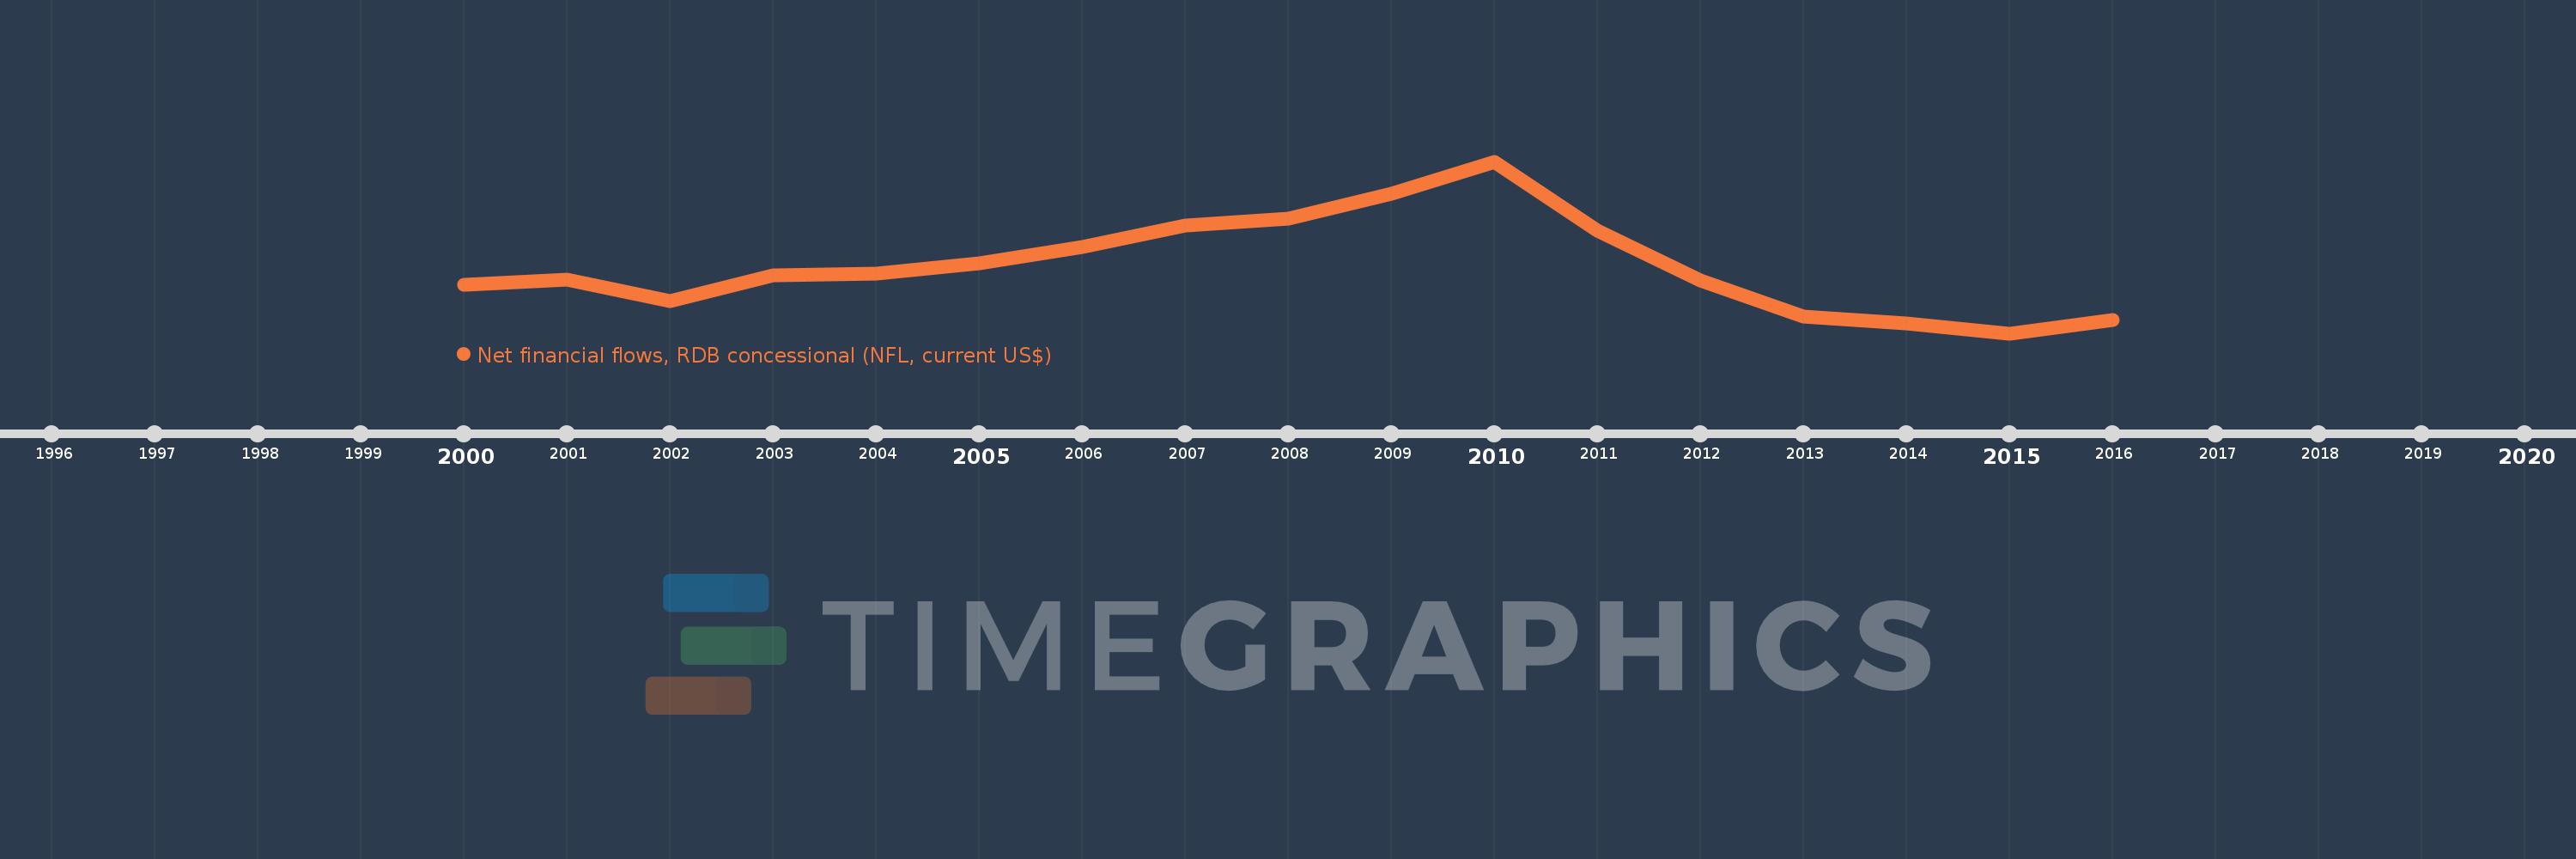
Net financial flows, RDB concessional (NFL, current US$)
2016,2015,2014,2013,2012,2011,2010,2009,2008,2007,2006,2005,2004,2003,2002,2001,2000
This statistics in other country:
Timeline:
This timeline shows a graph from 2000 to 2016 of Tajikistan. No data until 1999. Number of actual observations by date: 17.
Source name:
World Development Indicators
Source organization:
World Bank, International Debt Statistics.
Categories, topics:
External Debt
Last updated:
apr 23, 2017
Indicators value changes by year
Minimum:
-10.778 mln
jan 1, 2015
Maximum:
62.666 mln
jan 1, 2010
At the date of observation
Value
Absolute change
Change from previous value
jan 1, 2000
9.868 mln
+9.868 mln
0.0%
jan 1, 2001
12.323 mln
+2.455 mln
24.88%
jan 1, 2002
2.926 mln
-9.397 mln
-76.26%
jan 1, 2003
14.101 mln
+11.175 mln
381.92%
jan 1, 2004
14.68 mln
+579.0K
4.11%
jan 1, 2005
19.13 mln
+4.45 mln
30.31%
jan 1, 2006
26.11 mln
+6.98 mln
36.49%
jan 1, 2007
35.165 mln
+9.055 mln
34.68%
jan 1, 2008
38.334 mln
+3.169 mln
9.01%
jan 1, 2009
48.937 mln
+10.603 mln
27.66%
jan 1, 2010
62.666 mln
+13.729 mln
28.05%
jan 1, 2011
32.963 mln
-29.703 mln
-47.4%
jan 1, 2012
11.678 mln
-21.285 mln
-64.57%
jan 1, 2013
-3.654 mln
-15.332 mln
-131.29%
jan 1, 2014
-6.52 mln
-2.866 mln
78.43%
jan 1, 2015
-10.778 mln
-4.258 mln
65.31%
jan 1, 2016
-4.908 mln
+5.87 mln
-54.46%
Ranking of countries by current statistics by years


Comments: