29
/
en
AIzaSyAYiBZKx7MnpbEhh9jyipgxe19OcubqV5w
April 1, 2024
259660
Tajikistan
TJK
true
2
1
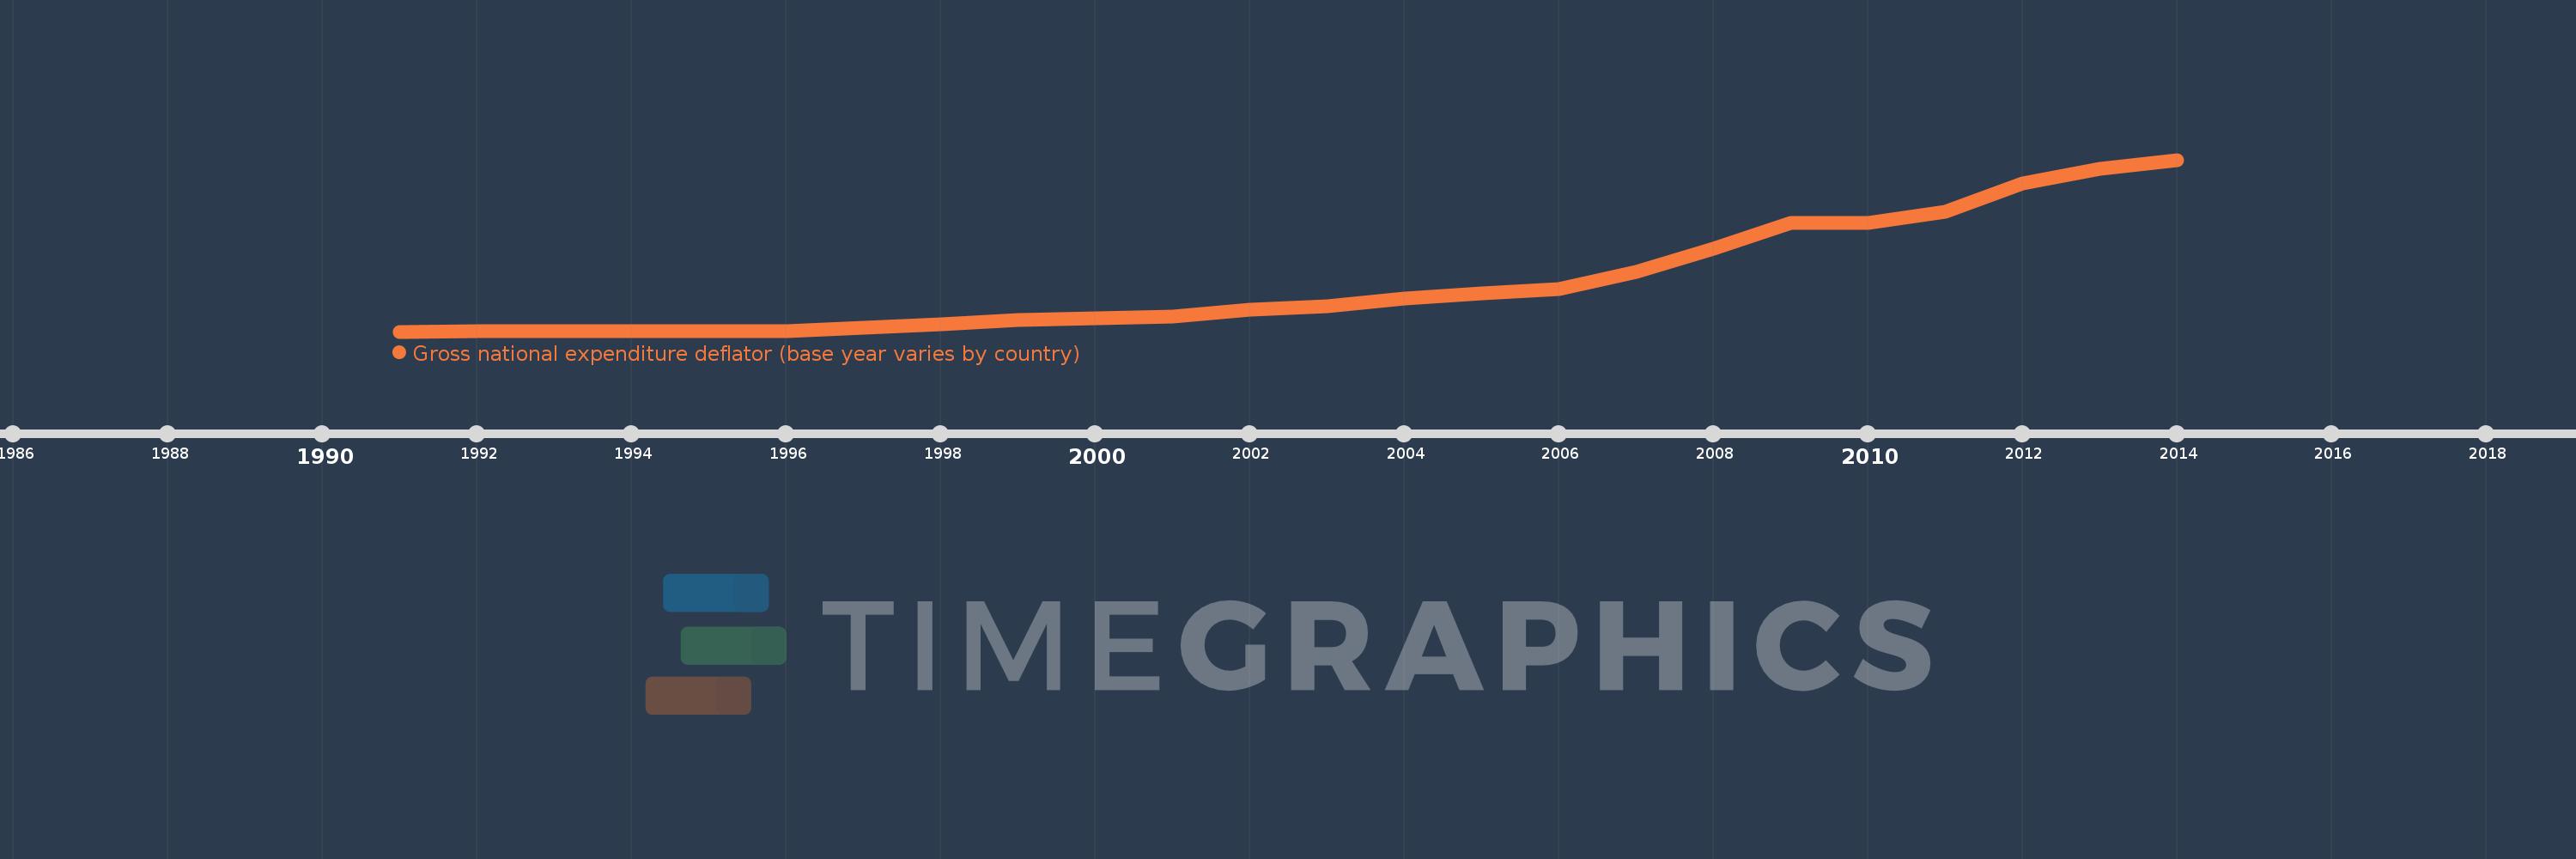
Gross national expenditure deflator (base year varies by country)
2014,2013,2012,2011,2010,2009,2008,2007,2006,2005,2004,2003,2002,2001,2000,1999,1998,1997,1996,1995,1994,1993,1992,1991
This statistics in other country:
AlbaniaAlgeriaAngolaAntigua and BarbudaArgentinaArmeniaAustraliaAustriaAzerbaijanBahamas, TheBahrainBangladeshBarbadosBelarusBelgiumBelizeBeninBhutanBoliviaBosnia and HerzegovinaBotswanaBrazilBrunei DarussalamBulgariaBurkina FasoBurundiCabo VerdeCambodiaCameroonCanadaChadChileChinaColombiaComorosCongo, Dem. Rep.Congo, Rep.Costa RicaCote d'IvoireCroatiaCubaCyprusCzech RepublicDenmarkDjiboutiDominican RepublicEcuadorEgypt, Arab Rep.El SalvadorEquatorial GuineaEritreaEstoniaEthiopiaFijiFinlandFranceGabonGambia, TheGeorgiaGermanyGhanaGreeceGuatemalaGuineaGuinea-BissauHaitiHondurasHong Kong SAR, ChinaHungaryIcelandIndiaIndonesiaIran, Islamic Rep.IrelandIsraelItalyJamaicaJapanJordanKazakhstanKenyaKorea, Rep.KosovoKuwaitKyrgyz RepublicLao PDRLatviaLebanonLiberiaLibyaLithuaniaLuxembourgMacao SAR, ChinaMacedonia, FYRMadagascarMalawiMalaysiaMaliMaltaMauritaniaMauritiusMexicoMoldovaMongoliaMontenegroMoroccoMozambiqueMyanmarNamibiaNepalNetherlandsNew ZealandNicaraguaNigerNigeriaNorwayOmanPakistanPanamaPapua New GuineaParaguayPeruPhilippinesPolandPortugalPuerto RicoQatarRomaniaRussian FederationRwandaSamoaSaudi ArabiaSenegalSerbiaSeychellesSierra LeoneSingaporeSlovak RepublicSloveniaSomaliaSouth AfricaSouth SudanSpainSri LankaSudanSurinameSwazilandSwedenSwitzerlandSyrian Arab RepublicTajikistanTanzaniaThailandTimor-LesteTogoTrinidad and TobagoTunisiaTurkeyTurkmenistanUgandaUkraineUnited Arab EmiratesUnited KingdomUnited StatesUruguayUzbekistanVanuatuVenezuela, RBVietnamWest Bank and GazaZambiaZimbabwe Timeline:
This timeline shows a graph from 1991 to 2014 of Tajikistan. No data until 1990. Number of actual observations by date: 24.
Source name:
World Development Indicators
Source organization:
World Bank national accounts data, and OECD National Accounts data files.
Categories, topics:
Economy & Growth
Last updated:
apr 23, 2017
Indicators value changes by year
Maximum:
1.118K
jan 1, 2014
At the date of observation
Value
Absolute change
Change from previous value
jan 1, 1991
0.002
+0.002
0.0%
jan 1, 1992
0.003
+0.001
84.31%
jan 1, 1993
0.022
+0.019
600.12%
jan 1, 1994
0.241
+0.219
978.8%
jan 1, 1995
0.951
+0.71
294.34%
jan 1, 1996
3.716
+2.765
290.81%
jan 1, 1997
22.962
+19.246
517.88%
jan 1, 1998
48.693
+25.731
112.06%
jan 1, 1999
74.148
+25.455
52.28%
jan 1, 2000
87.086
+12.938
17.45%
jan 1, 2001
100.005
+12.918
14.83%
jan 1, 2002
141.358
+41.353
41.35%
jan 1, 2003
164.433
+23.076
16.32%
jan 1, 2004
214.905
+50.471
30.69%
jan 1, 2005
249.281
+34.376
16.0%
jan 1, 2006
276.47
+27.189
10.91%
jan 1, 2007
390.703
+114.233
41.32%
jan 1, 2008
537.345
+146.642
37.53%
jan 1, 2009
708.528
+171.183
31.86%
jan 1, 2010
709.23
+0.702
0.1%
jan 1, 2011
782.281
+73.051
10.3%
jan 1, 2012
961.674
+179.392
22.93%
jan 1, 2013
1.061K
+99.364
10.33%
jan 1, 2014
1.118K
+56.836
5.36%
Ranking of countries by current statistics by years


Comments: