29
/
en
AIzaSyAYiBZKx7MnpbEhh9jyipgxe19OcubqV5w
April 1, 2024
257622
Switzerland
CHE
true
2
1
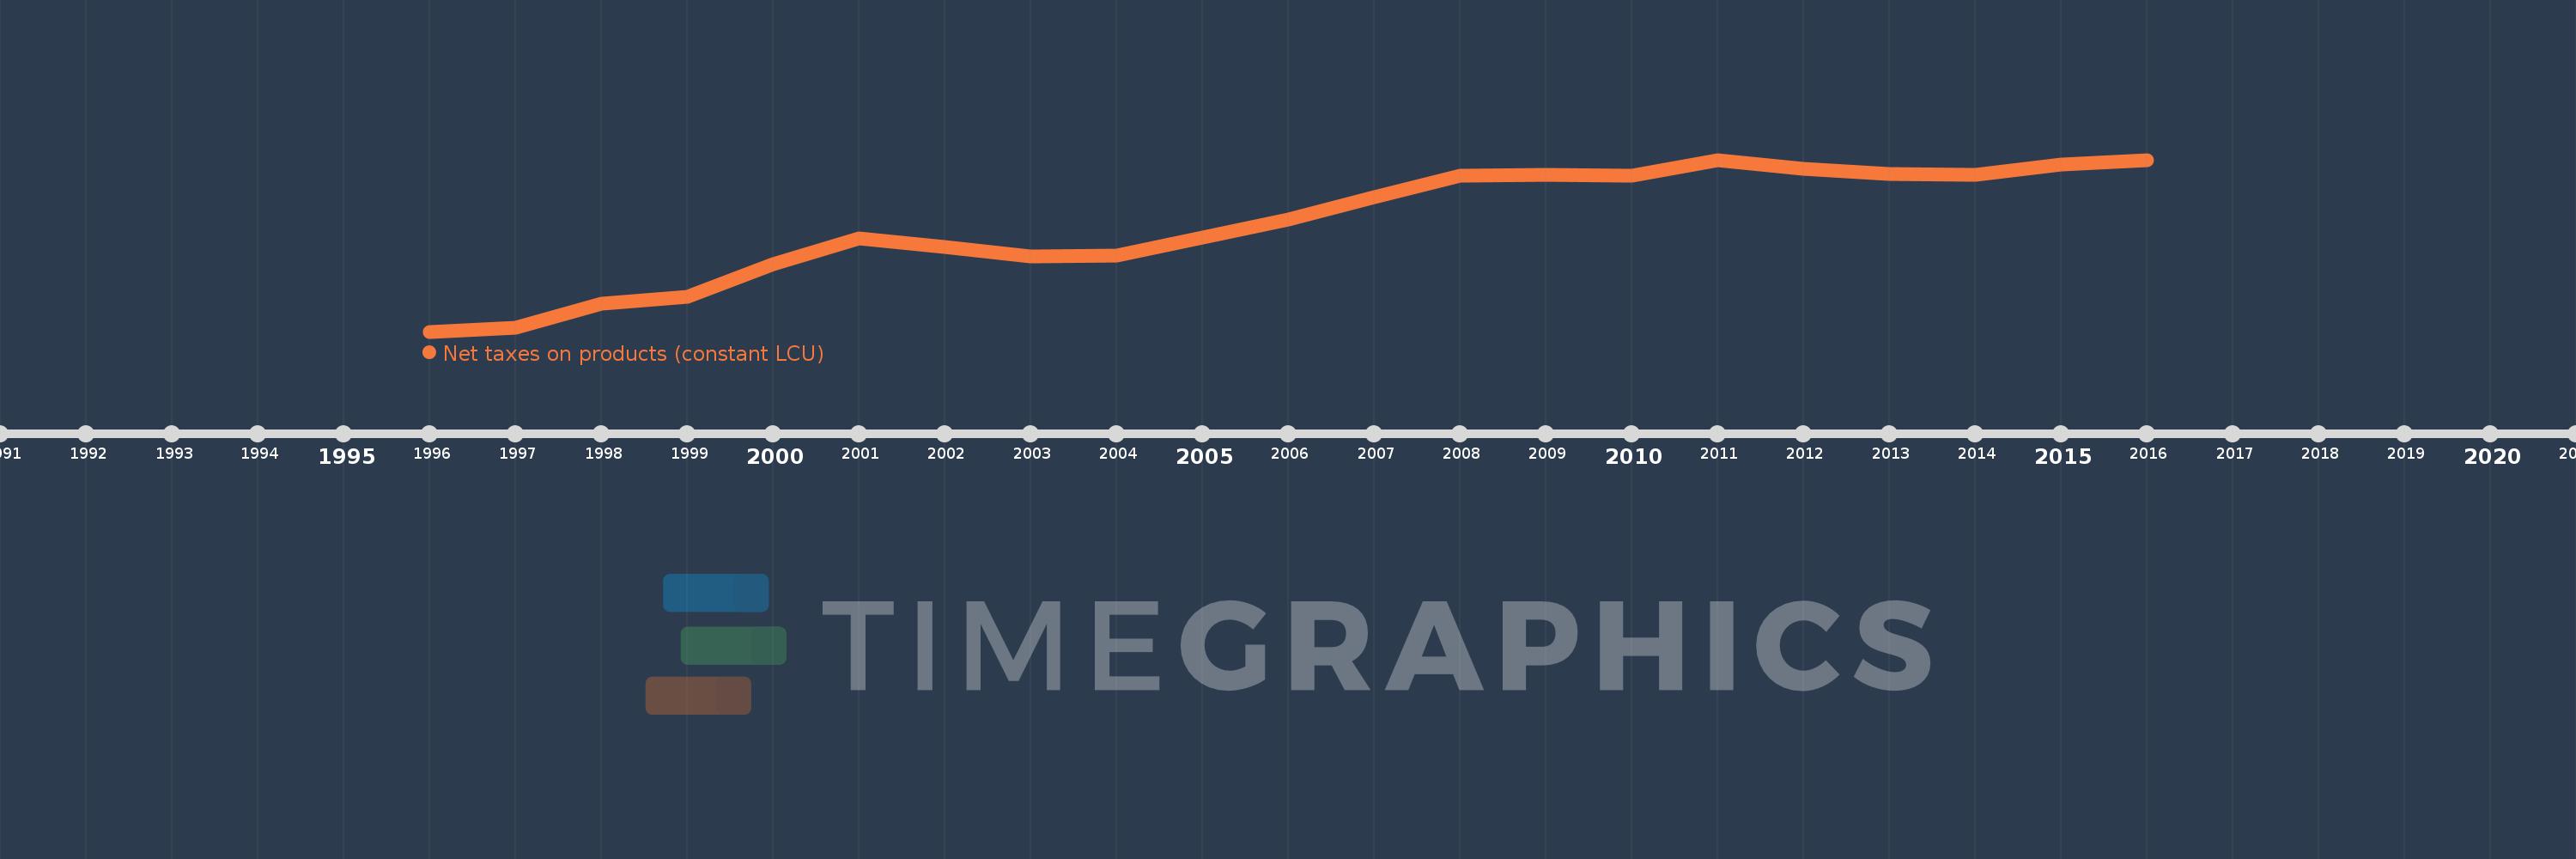
Net taxes on products (constant LCU)
2016,2015,2014,2013,2012,2011,2010,2009,2008,2007,2006,2005,2004,2003,2002,2001,2000,1999,1998,1997,1996
This statistics in other country:
Timeline:
This timeline shows a graph from 1996 to 2016 of Switzerland. No data until 1995. Number of actual observations by date: 21.
Source name:
World Development Indicators
Source organization:
World Bank national accounts data, and OECD National Accounts data files.
Categories, topics:
Economy & Growth
Last updated:
apr 23, 2017
Indicators value changes by year
Minimum:
12.36 bln
jan 1, 1996
Maximum:
22.35 bln
jan 1, 2011
At the date of observation
Value
Absolute change
Change from previous value
jan 1, 1996
12.36 bln
+12.36 bln
0.0%
jan 1, 1997
12.583 bln
+222.877 mln
1.8%
jan 1, 1998
13.997 bln
+1.413 bln
11.23%
jan 1, 1999
14.363 bln
+366.313 mln
2.62%
jan 1, 2000
16.29 bln
+1.927 bln
13.42%
jan 1, 2001
17.781 bln
+1.49 bln
9.15%
jan 1, 2002
17.299 bln
-481.275 mln
-2.71%
jan 1, 2003
16.747 bln
-552.424 mln
-3.19%
jan 1, 2004
16.782 bln
+35.419 mln
0.21%
jan 1, 2005
17.841 bln
+1.059 bln
6.31%
jan 1, 2006
18.88 bln
+1.038 bln
5.82%
jan 1, 2007
20.175 bln
+1.295 bln
6.86%
jan 1, 2008
21.449 bln
+1.274 bln
6.32%
jan 1, 2009
21.455 bln
+5.37 mln
0.03%
jan 1, 2010
21.413 bln
-42.023 mln
-0.2%
jan 1, 2011
22.35 bln
+936.998 mln
4.38%
jan 1, 2012
21.841 bln
-508.529 mln
-2.28%
jan 1, 2013
21.543 bln
-297.597 mln
-1.36%
jan 1, 2014
21.485 bln
-58.039 mln
-0.27%
jan 1, 2015
22.06 bln
+574.923 mln
2.68%
jan 1, 2016
22.305 bln
+244.984 mln
1.11%
Ranking of countries by current statistics by years


Comments: