29
/
en
AIzaSyAYiBZKx7MnpbEhh9jyipgxe19OcubqV5w
April 1, 2024
256695
Sweden
SWE
true
2
1
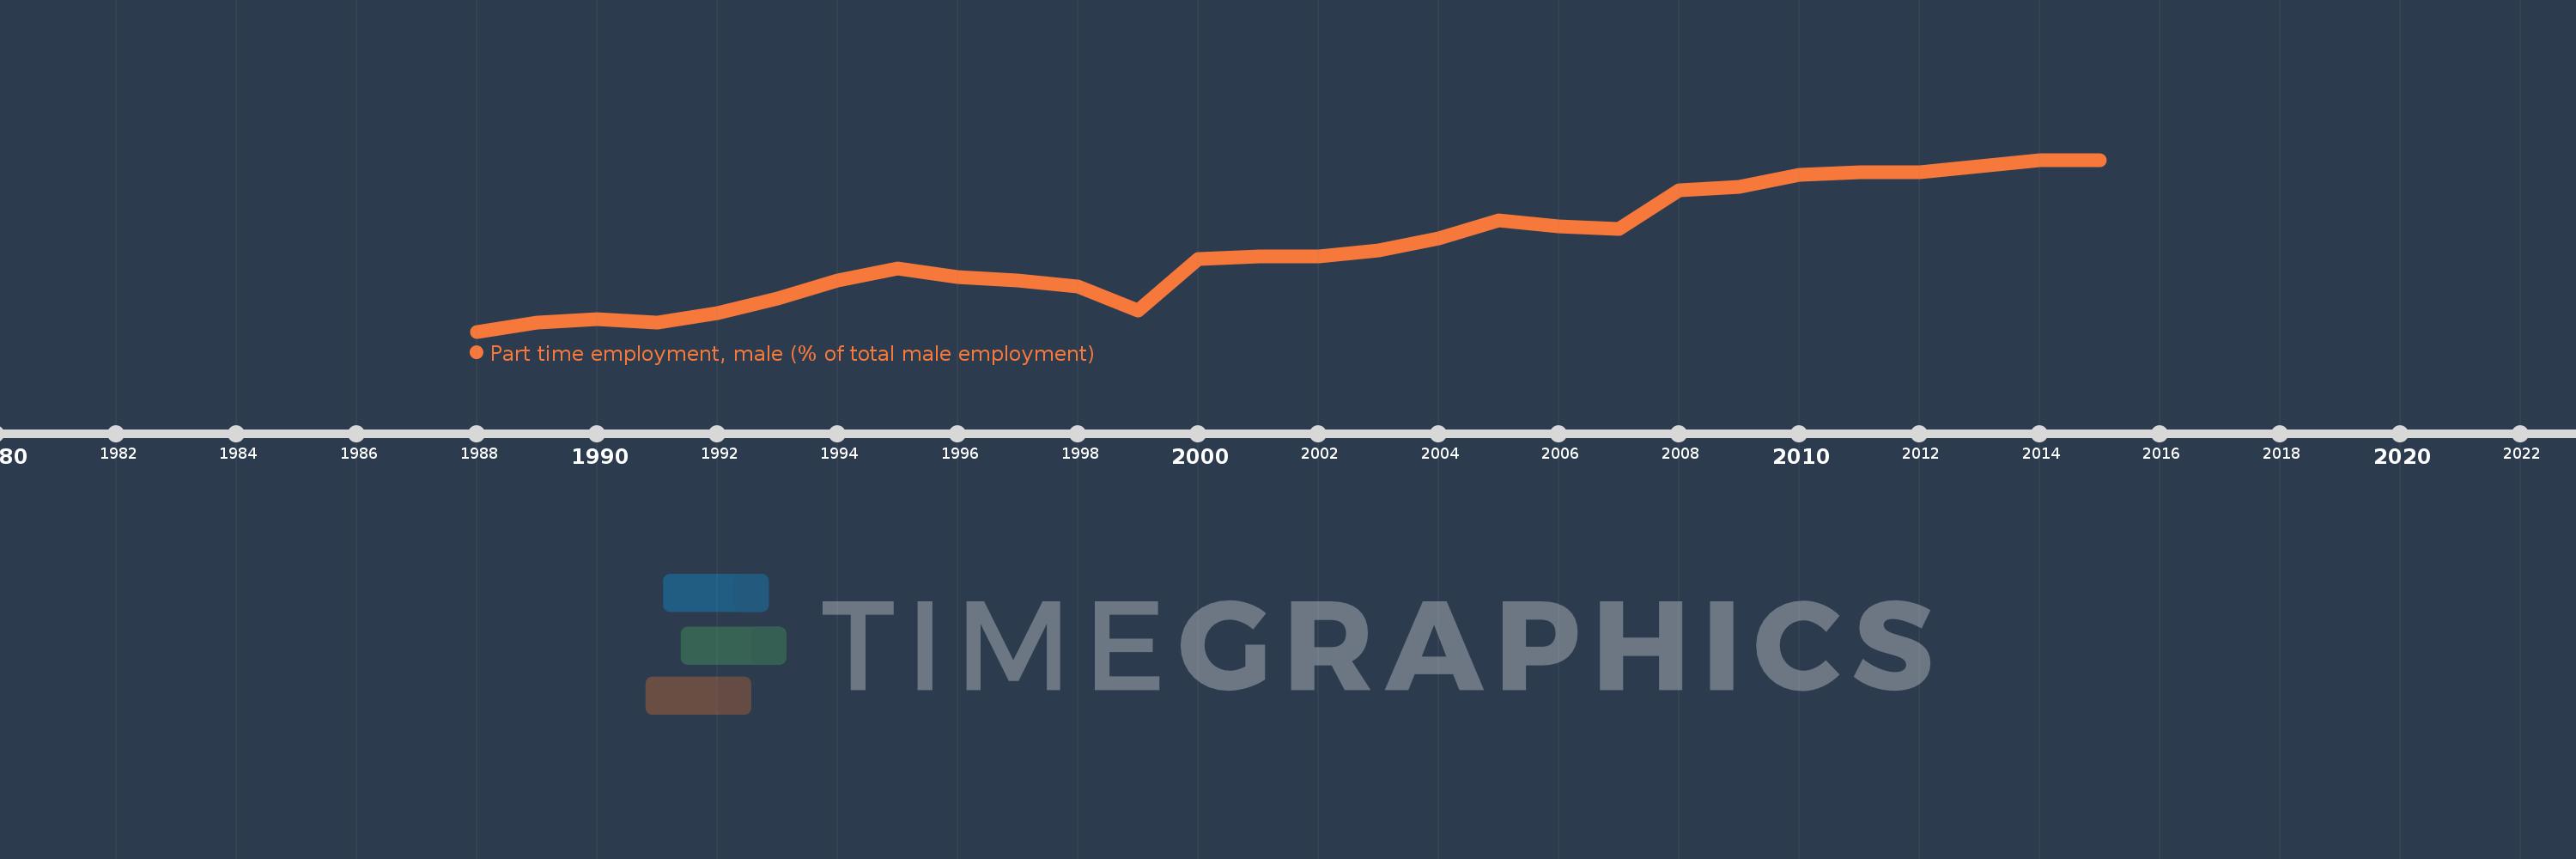
Part time employment, male (% of total male employment)
2015,2014,2013,2012,2011,2010,2009,2008,2007,2006,2005,2004,2003,2002,2001,2000,1999,1998,1997,1996,1995,1994,1993,1992,1991,1990,1989,1988
This statistics in other country:
Timeline:
This timeline shows a graph from 1988 to 2015 of Sweden. No data until 1987. Number of actual observations by date: 28.
Source name:
World Development Indicators
Source organization:
International Labour Organization, Key Indicators of the Labour Market database.
Categories, topics:
Social Protection & Labor, Gender
Last updated:
apr 23, 2017
Indicators value changes by year
At the date of observation
Value
Absolute change
Change from previous value
jan 1, 1989
5.1
+0.3
6.25%
jan 1, 1990
5.2
+0.1
1.96%
jan 1, 1991
5.1
-0.1
-1.92%
jan 1, 1992
5.4
+0.3
5.88%
jan 1, 1993
5.9
+0.5
9.26%
jan 1, 1994
6.5
+0.6
10.17%
jan 1, 1995
6.9
+0.4
6.15%
jan 1, 1996
6.6
-0.3
-4.35%
jan 1, 1997
6.5
-0.1
-1.52%
jan 1, 1998
6.3
-0.2
-3.08%
jan 1, 1999
5.5
-0.8
-12.7%
jan 1, 2000
7.2
+1.7
30.91%
jan 1, 2001
7.3
+0.1
1.39%
jan 1, 2003
7.5
+0.2
2.74%
jan 1, 2004
7.9
+0.4
5.33%
jan 1, 2005
8.5
+0.6
7.59%
jan 1, 2006
8.3
-0.2
-2.35%
jan 1, 2007
8.2
-0.1
-1.2%
jan 1, 2008
9.5
+1.3
15.85%
jan 1, 2009
9.6
+0.1
1.05%
jan 1, 2010
10.0
+0.4
4.17%
jan 1, 2011
10.1
+0.1
1.0%
jan 1, 2013
10.3
+0.2
1.98%
jan 1, 2014
10.5
+0.2
1.94%
Ranking of countries by current statistics by years


Comments: