29
/
en
AIzaSyAYiBZKx7MnpbEhh9jyipgxe19OcubqV5w
April 1, 2024
256201
Sweden
SWE
true
2
1
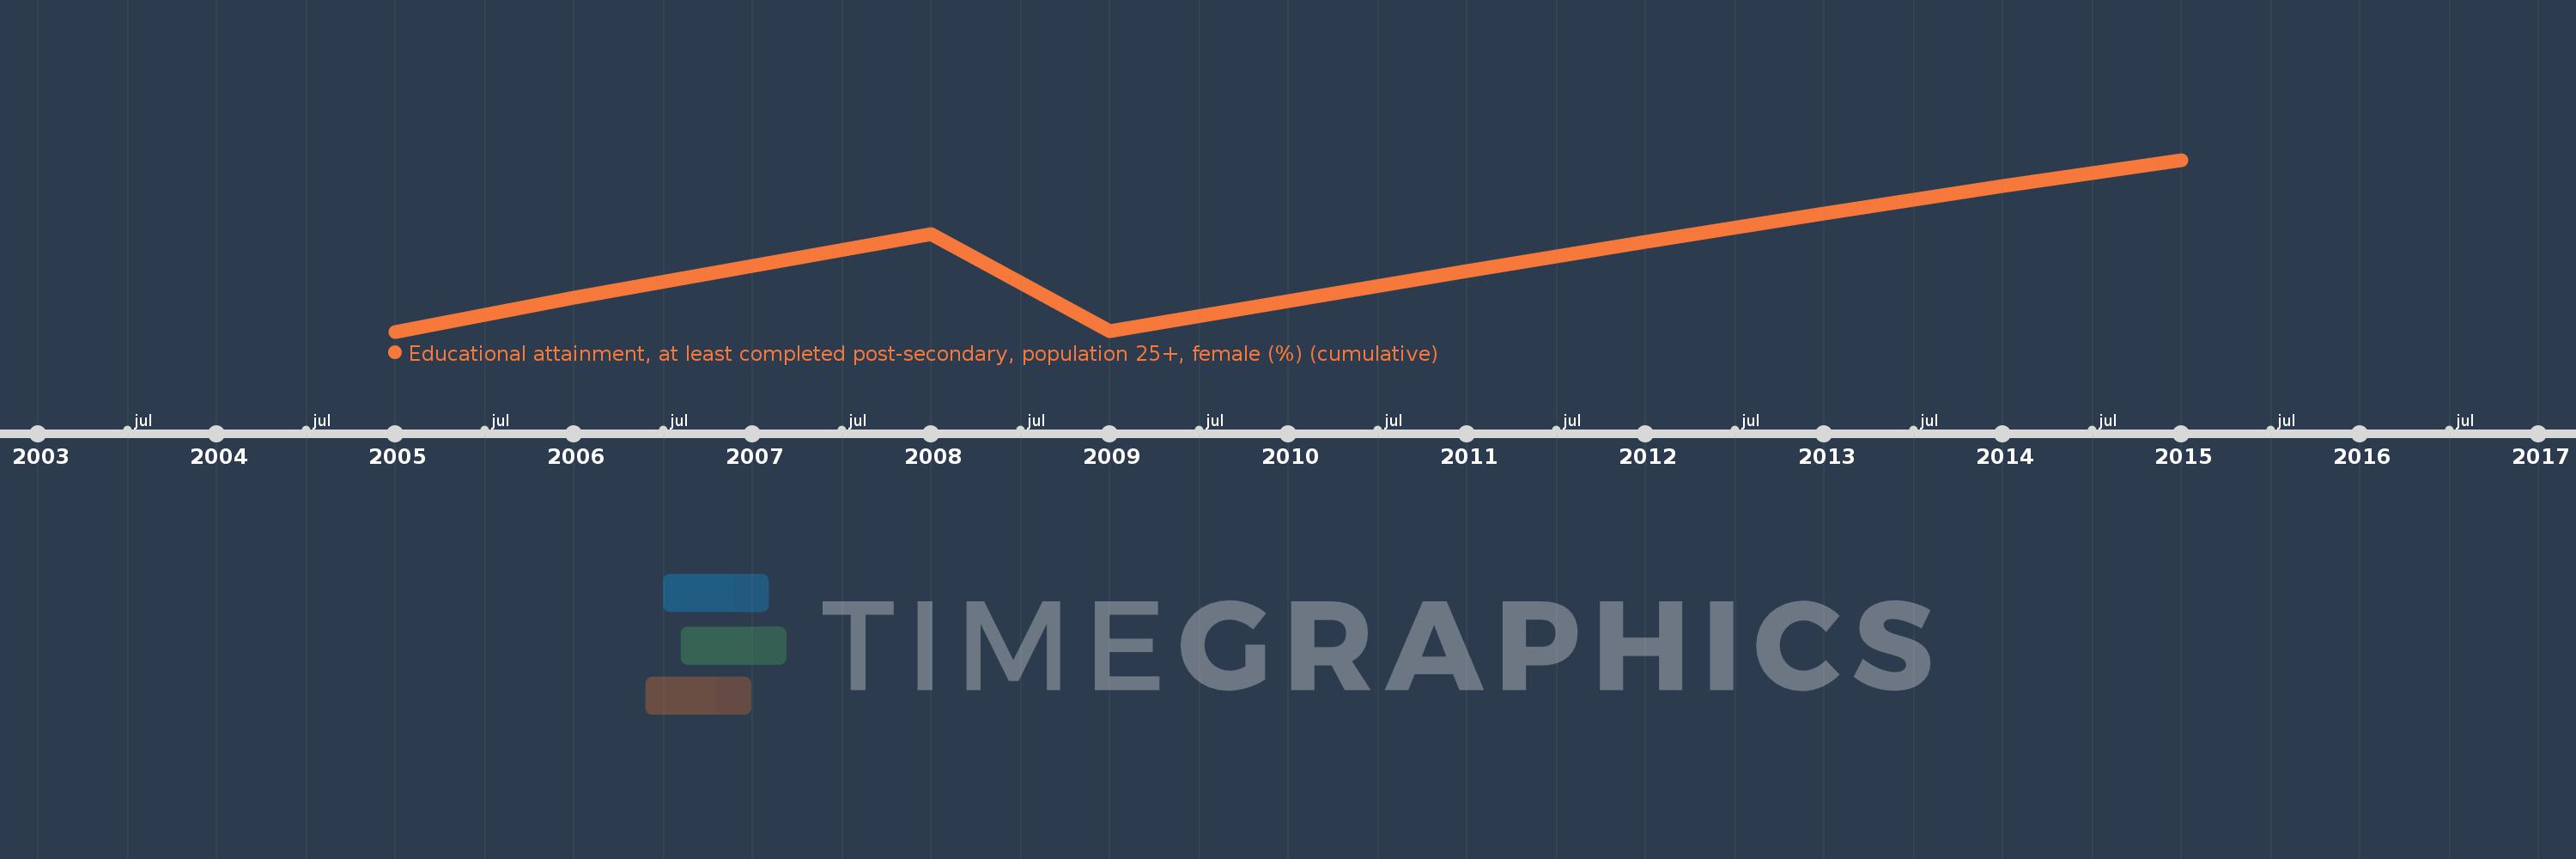
Educational attainment, at least completed post-secondary, population 25+, female (%) (cumulative)
2015,2014,2013,2012,2011,2010,2009,2008,2007,2006,2005
This statistics in other country:
Timeline:
This timeline shows a graph from 2005 to 2015 of Sweden. No data until 2004. Number of actual observations by date: 11.
Source name:
World Development Indicators
Source organization:
United Nations Educational, Scientific, and Cultural Organization (UNESCO) Institute for Statistics.
Categories, topics:
Education, Gender
Last updated:
apr 23, 2017
Indicators value changes by year
Minimum:
34.327
jan 1, 2005
Maximum:
39.708
jan 1, 2015
At the date of observation
Value
Absolute change
Change from previous value
jan 1, 2005
34.327
+34.327
0.0%
jan 1, 2006
35.401
+1.074
3.13%
jan 1, 2007
36.396
+0.994
2.81%
jan 1, 2008
37.379
+0.984
2.7%
jan 1, 2009
34.352
-3.027
-8.1%
jan 1, 2010
35.292
+0.94
2.74%
jan 1, 2011
36.222
+0.93
2.63%
jan 1, 2012
37.14
+0.918
2.53%
jan 1, 2013
38.016
+0.876
2.36%
jan 1, 2014
38.882
+0.866
2.28%
jan 1, 2015
39.708
+0.825
2.12%
Ranking of countries by current statistics by years


Comments: