29
/
en
AIzaSyAYiBZKx7MnpbEhh9jyipgxe19OcubqV5w
April 1, 2024
252383
St. Vincent and the Grenadines
VCT
true
2
1
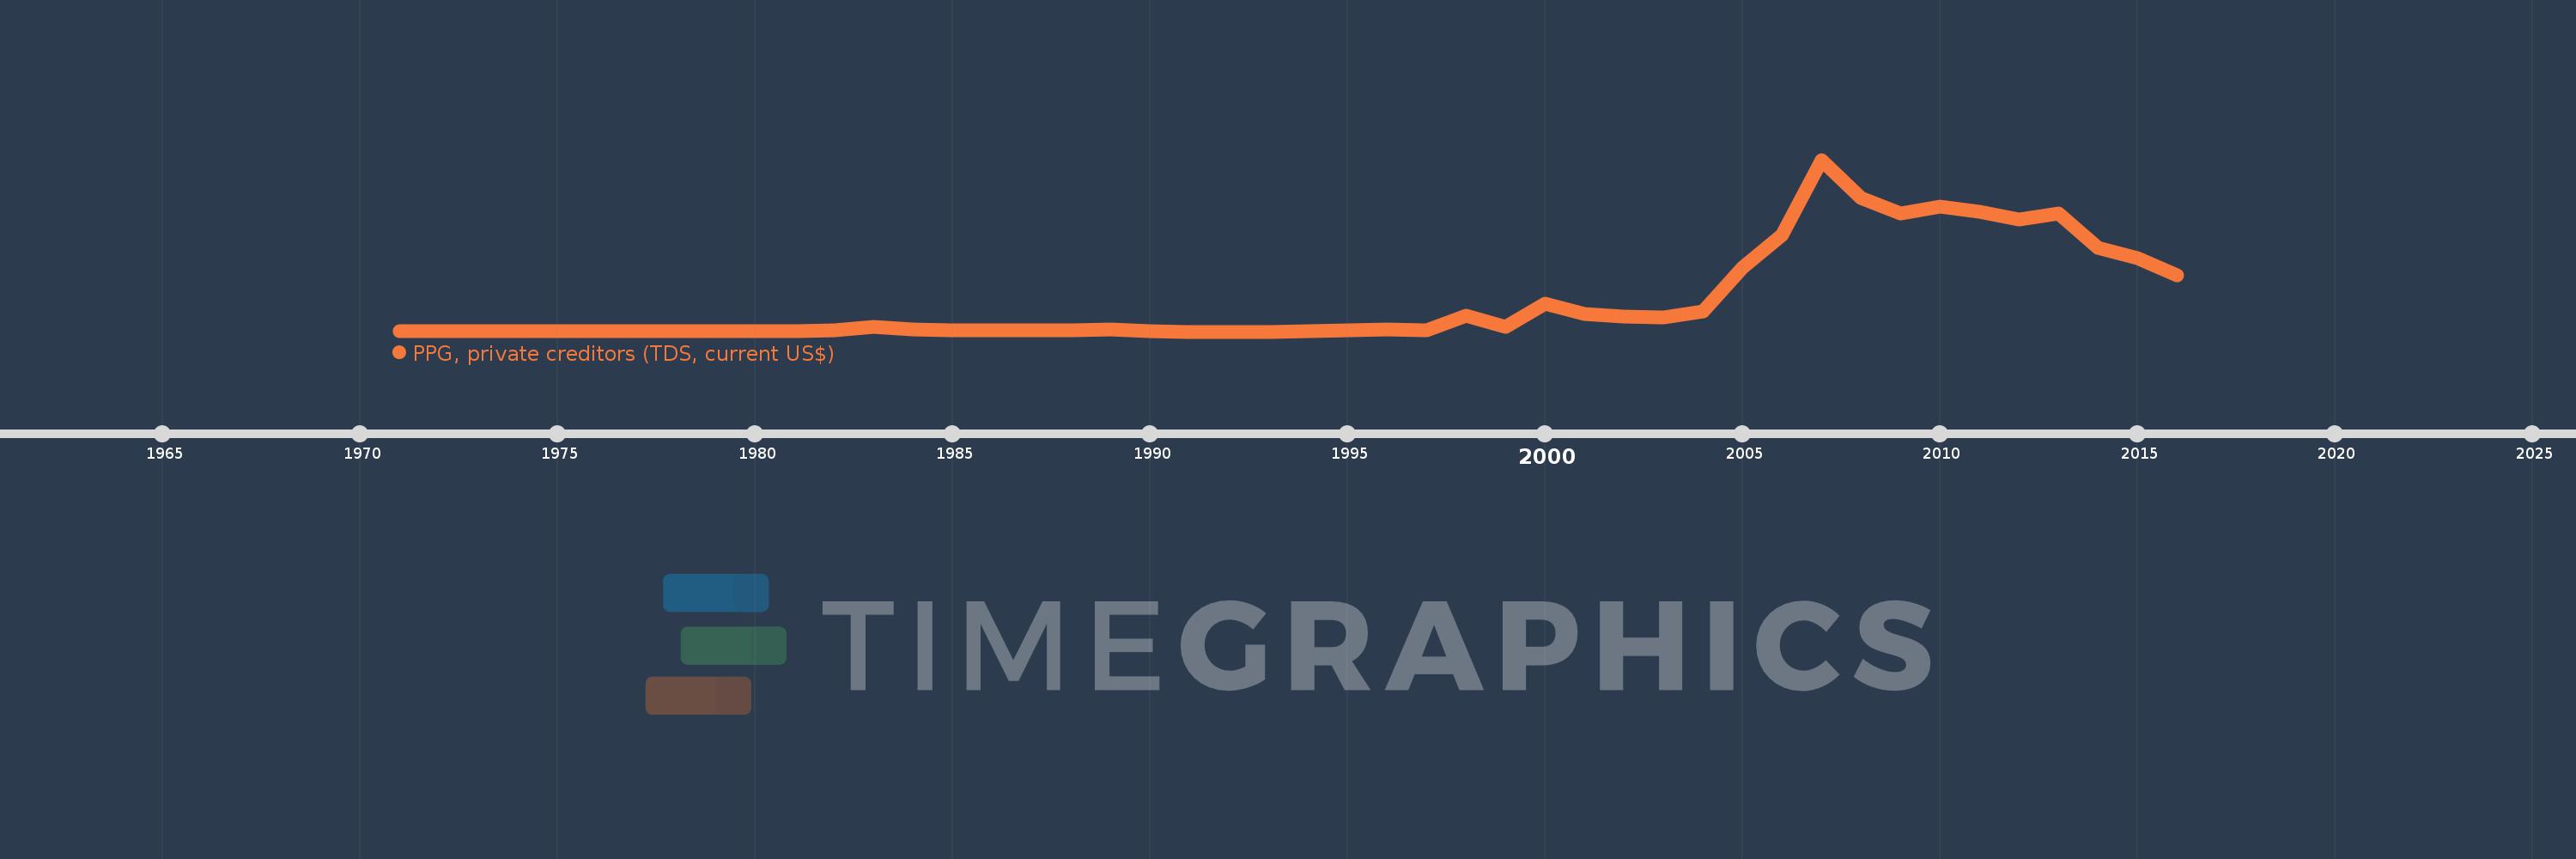
PPG, private creditors (TDS, current US$)
2016,2015,2014,2013,2012,2011,2010,2009,2008,2007,2006,2005,2004,2003,2002,2001,2000,1999,1998,1997,1996,1994,1993,1992,1991,1990,1989,1988,1987,1986,1985,1984,1983,1982,1981,1980,1979,1978,1977,1976,1975,1974,1973,1972,1971
This statistics in other country:
Timeline:
This timeline shows a graph from 1971 to 2016 of St. Vincent and the Grenadines. No data until 1970. Number of actual observations by date: 45.
Source name:
World Development Indicators
Source organization:
World Bank, International Debt Statistics.
Categories, topics:
External Debt
Last updated:
apr 23, 2017
Indicators value changes by year
Minimum:
1000.0
jan 1, 1991
Maximum:
22.094 mln
jan 1, 2007
At the date of observation
Value
Absolute change
Change from previous value
jan 1, 1971
82.0K
+82.0K
0.0%
jan 1, 1972
56.0K
-26.0K
-31.71%
jan 1, 1973
43.0K
-13.0K
-23.21%
jan 1, 1974
56.0K
+13.0K
30.23%
jan 1, 1975
53.0K
-3.0K
-5.36%
jan 1, 1976
47.0K
-6.0K
-11.32%
jan 1, 1977
44.0K
-3.0K
-6.38%
jan 1, 1978
44.0K
0.0
0.0%
jan 1, 1979
40.0K
-4.0K
-9.09%
jan 1, 1980
53.0K
+13.0K
32.5%
jan 1, 1981
58.0K
+5.0K
9.43%
jan 1, 1982
153.0K
+95.0K
163.79%
jan 1, 1983
631.0K
+478.0K
312.42%
jan 1, 1984
331.0K
-300.0K
-47.54%
jan 1, 1985
148.0K
-183.0K
-55.29%
jan 1, 1986
138.0K
-10.0K
-6.76%
jan 1, 1987
143.0K
+5.0K
3.62%
jan 1, 1988
153.0K
+10.0K
6.99%
jan 1, 1989
296.0K
+143.0K
93.46%
jan 1, 1990
4.0K
-292.0K
-98.65%
jan 1, 1991
1000.0
-3.0K
-75.0%
jan 1, 1992
1000.0
0.0
0.0%
jan 1, 1993
1000.0
0.0
0.0%
jan 1, 1994
20.0K
+19.0K
1.9K%
jan 1, 1996
284.0K
+264.0K
1.32K%
jan 1, 1997
134.0K
-150.0K
-52.82%
jan 1, 1998
2.089 mln
+1.955 mln
1.46K%
jan 1, 1999
596.0K
-1.493 mln
-71.47%
jan 1, 2000
3.612 mln
+3.016 mln
506.04%
jan 1, 2001
2.224 mln
-1.388 mln
-38.43%
jan 1, 2002
1.943 mln
-281.0K
-12.63%
jan 1, 2003
1.797 mln
-146.0K
-7.51%
jan 1, 2004
2.586 mln
+789.0K
43.91%
jan 1, 2005
8.188 mln
+5.602 mln
216.63%
jan 1, 2006
12.412 mln
+4.224 mln
51.59%
jan 1, 2007
22.094 mln
+9.682 mln
78.01%
jan 1, 2008
17.128 mln
-4.966 mln
-22.48%
jan 1, 2009
15.226 mln
-1.902 mln
-11.1%
jan 1, 2010
16.112 mln
+886.0K
5.82%
jan 1, 2011
15.413 mln
-699.0K
-4.34%
jan 1, 2012
14.373 mln
-1.04 mln
-6.75%
jan 1, 2013
15.181 mln
+808.0K
5.62%
jan 1, 2014
10.783 mln
-4.398 mln
-28.97%
jan 1, 2015
9.5 mln
-1.283 mln
-11.9%
jan 1, 2016
7.218 mln
-2.282 mln
-24.02%
Ranking of countries by current statistics by years


Comments: