29
/
en
AIzaSyAYiBZKx7MnpbEhh9jyipgxe19OcubqV5w
April 1, 2024
252381
St. Vincent and the Grenadines
VCT
true
2
1
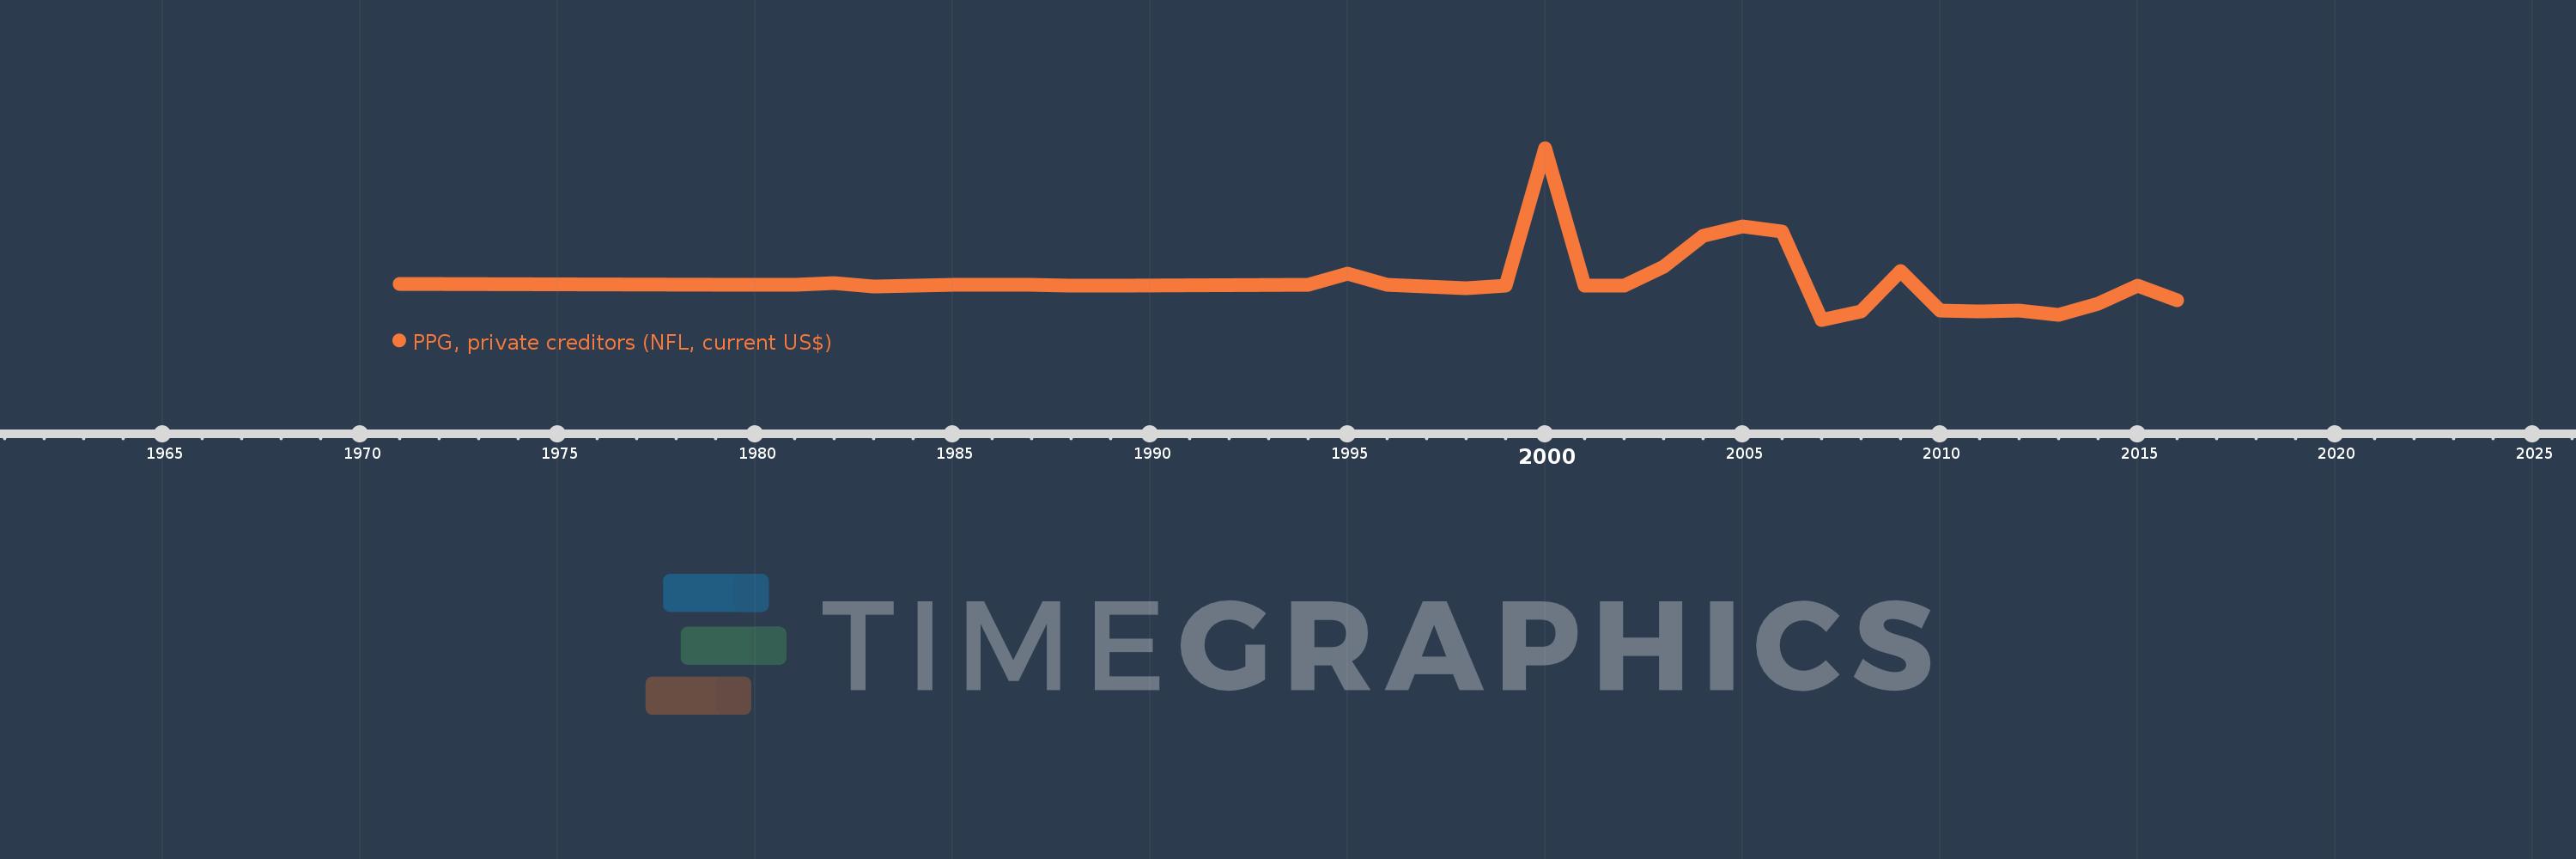
PPG, private creditors (NFL, current US$)
2016,2015,2014,2013,2012,2011,2010,2009,2008,2007,2006,2005,2004,2003,2002,2001,2000,1999,1998,1996,1995,1994,1989,1988,1987,1986,1985,1984,1983,1982,1981,1980,1971
This statistics in other country:
Timeline:
This timeline shows a graph from 1971 to 2016 of St. Vincent and the Grenadines. No data until 1970. Number of actual observations by date: 33.
Source name:
World Development Indicators
Source organization:
World Bank, International Debt Statistics.
Categories, topics:
External Debt
Last updated:
apr 23, 2017
Indicators value changes by year
Minimum:
-14.621 mln
jan 1, 2007
Maximum:
57.482 mln
jan 1, 2000
At the date of observation
Value
Absolute change
Change from previous value
jan 1, 1971
360.0K
+360.0K
0.0%
jan 1, 1980
223.0K
-137.0K
-38.06%
jan 1, 1981
135.0K
-88.0K
-39.46%
jan 1, 1982
945.0K
+810.0K
600.0%
jan 1, 1983
-548.0K
-1.493 mln
-157.99%
jan 1, 1984
-235.0K
+313.0K
-57.12%
jan 1, 1985
-116.0K
+119.0K
-50.64%
jan 1, 1986
-109.0K
+7.0K
-6.03%
jan 1, 1987
-119.0K
-10.0K
9.17%
jan 1, 1988
-136.0K
-17.0K
14.29%
jan 1, 1989
-276.0K
-140.0K
102.94%
jan 1, 1994
-19.0K
+257.0K
-93.12%
jan 1, 1995
4.749 mln
+4.768 mln
-25.09K%
jan 1, 1996
51.0K
-4.698 mln
-98.93%
jan 1, 1998
-1.56 mln
-1.611 mln
-3.16K%
jan 1, 1999
-400.0K
+1.16 mln
-74.36%
jan 1, 2000
57.482 mln
+57.882 mln
-14.47K%
jan 1, 2001
-400.0K
-57.882 mln
-100.7%
jan 1, 2002
-400.0K
0.0
0.0%
jan 1, 2003
7.515 mln
+7.915 mln
-1.98K%
jan 1, 2004
20.681 mln
+13.166 mln
175.2%
jan 1, 2005
24.47 mln
+3.789 mln
18.32%
jan 1, 2006
22.277 mln
-2.193 mln
-8.96%
jan 1, 2007
-14.621 mln
-36.898 mln
-165.63%
jan 1, 2008
-11.253 mln
+3.368 mln
-23.04%
jan 1, 2009
5.875 mln
+17.128 mln
-152.21%
jan 1, 2010
-10.74 mln
-16.615 mln
-282.81%
jan 1, 2011
-11.11 mln
-370.0K
3.45%
jan 1, 2012
-10.925 mln
+185.0K
-1.67%
jan 1, 2013
-12.423 mln
-1.498 mln
13.71%
jan 1, 2014
-7.9 mln
+4.523 mln
-36.41%
jan 1, 2015
-398.0K
+7.502 mln
-94.96%
jan 1, 2016
-6.387 mln
-5.989 mln
1.5K%
Ranking of countries by current statistics by years


Comments: