29
/
en
AIzaSyAYiBZKx7MnpbEhh9jyipgxe19OcubqV5w
April 1, 2024
252334
St. Vincent and the Grenadines
VCT
true
2
1
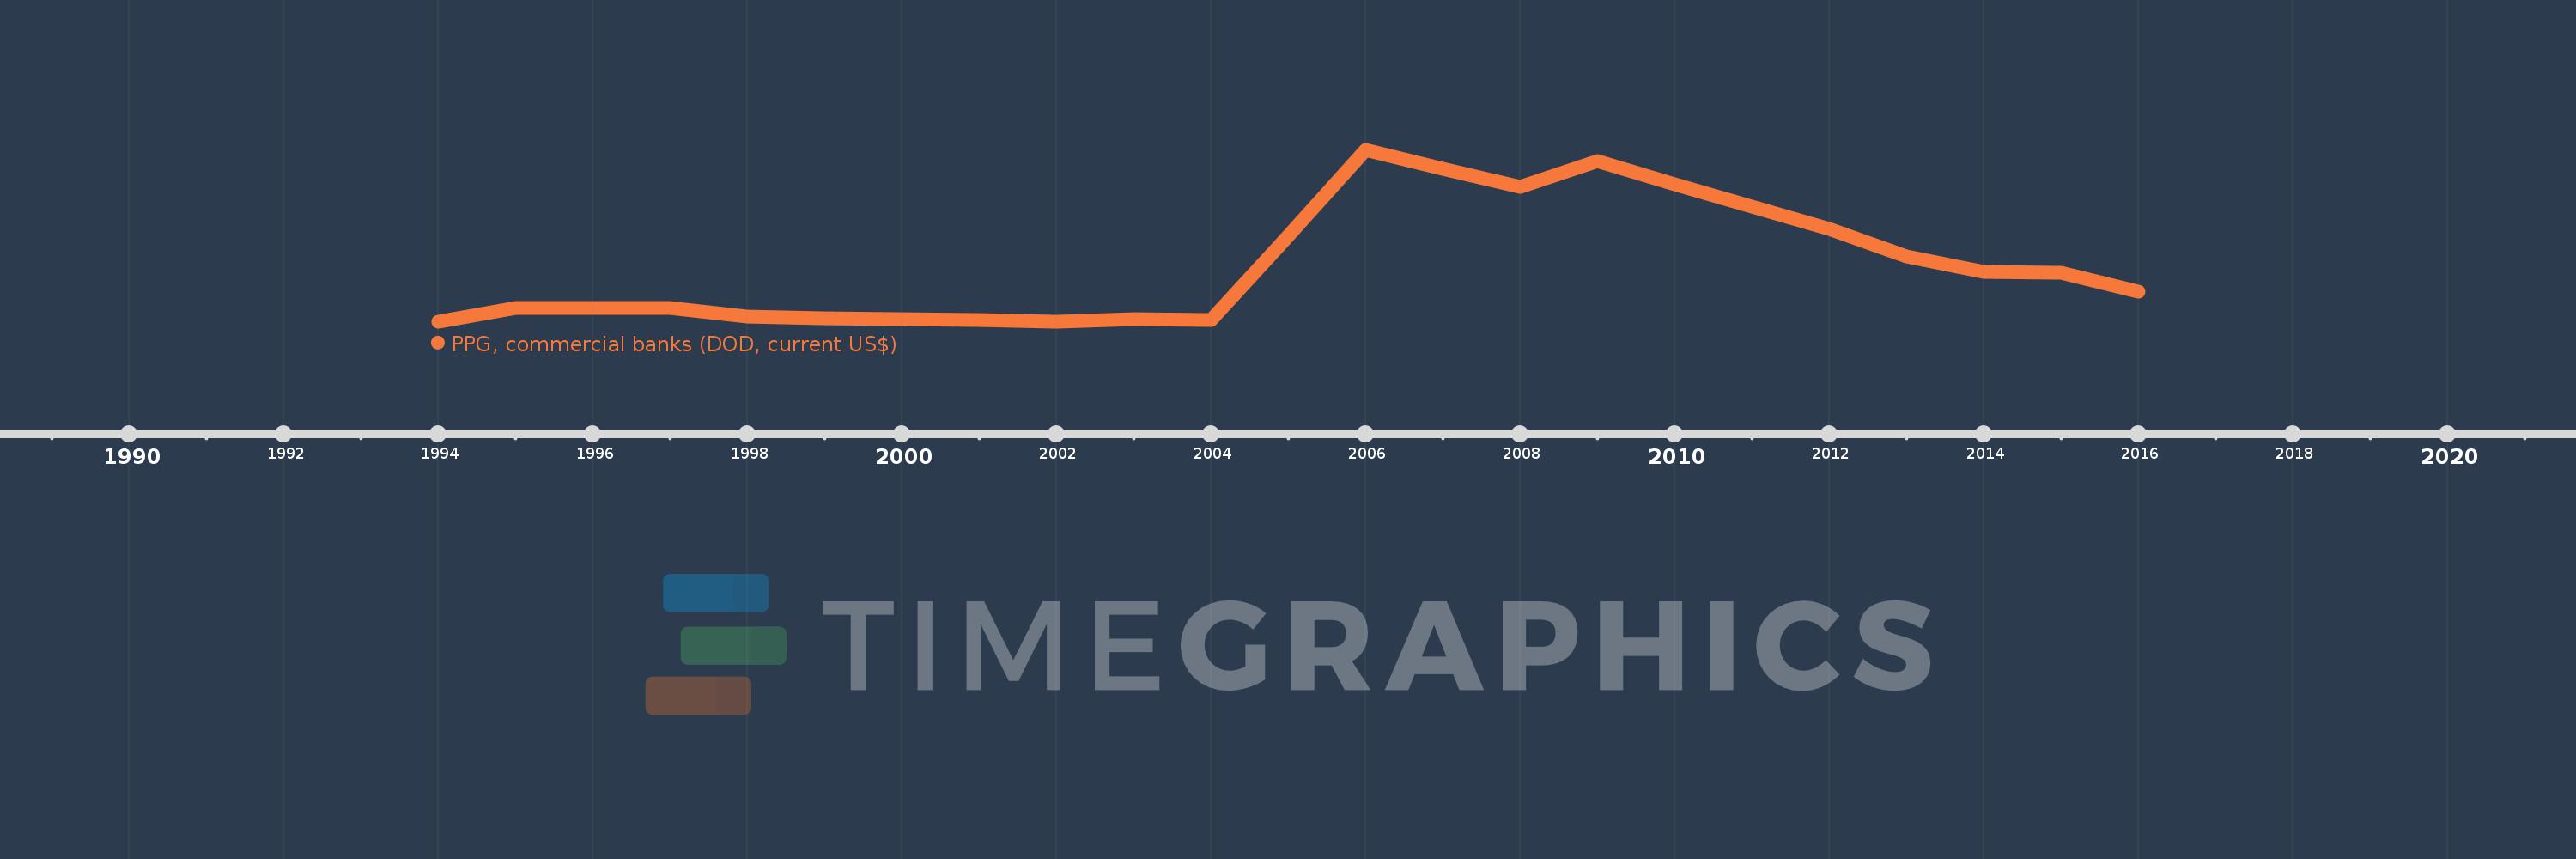
PPG, commercial banks (DOD, current US$)
2016,2015,2014,2013,2012,2011,2010,2009,2008,2007,2006,2005,2004,2003,2002,2001,2000,1999,1998,1997,1996,1995,1994
This statistics in other country:
Timeline:
This timeline shows a graph from 1994 to 2016 of St. Vincent and the Grenadines. No data until 1993. Number of actual observations by date: 23.
Source name:
World Development Indicators
Source organization:
World Bank, International Debt Statistics.
Categories, topics:
External Debt
Last updated:
apr 23, 2017
Indicators value changes by year
Maximum:
59.935 mln
jan 1, 2006
At the date of observation
Value
Absolute change
Change from previous value
jan 1, 1995
4.749 mln
+4.749 mln
%
jan 1, 1996
4.8 mln
+51.0K
1.07%
jan 1, 1997
4.8 mln
0.0
0.0%
jan 1, 1998
1.8 mln
-3.0 mln
-62.5%
jan 1, 1999
1.4 mln
-400.0K
-22.22%
jan 1, 2000
1000.0K
-400.0K
-28.57%
jan 1, 2001
600.0K
-400.0K
-40.0%
jan 1, 2002
200.0K
-400.0K
-66.67%
jan 1, 2003
840.0K
+640.0K
320.0%
jan 1, 2004
600.0K
-240.0K
-28.57%
jan 1, 2005
30.175 mln
+29.575 mln
4.93K%
jan 1, 2006
59.935 mln
+29.76 mln
98.62%
jan 1, 2007
53.502 mln
-6.433 mln
-10.73%
jan 1, 2008
47.19 mln
-6.312 mln
-11.8%
jan 1, 2009
56.077 mln
+8.887 mln
18.83%
jan 1, 2010
48.163 mln
-7.914 mln
-14.11%
jan 1, 2011
40.251 mln
-7.912 mln
-16.43%
jan 1, 2012
32.338 mln
-7.913 mln
-19.66%
jan 1, 2013
22.925 mln
-9.413 mln
-29.11%
jan 1, 2014
17.483 mln
-5.442 mln
-23.74%
jan 1, 2015
17.086 mln
-397.0K
-2.27%
jan 1, 2016
10.699 mln
-6.387 mln
-37.38%
Ranking of countries by current statistics by years


Comments: