29
/
en
AIzaSyAYiBZKx7MnpbEhh9jyipgxe19OcubqV5w
April 1, 2024
251706
St. Vincent and the Grenadines
VCT
true
2
1
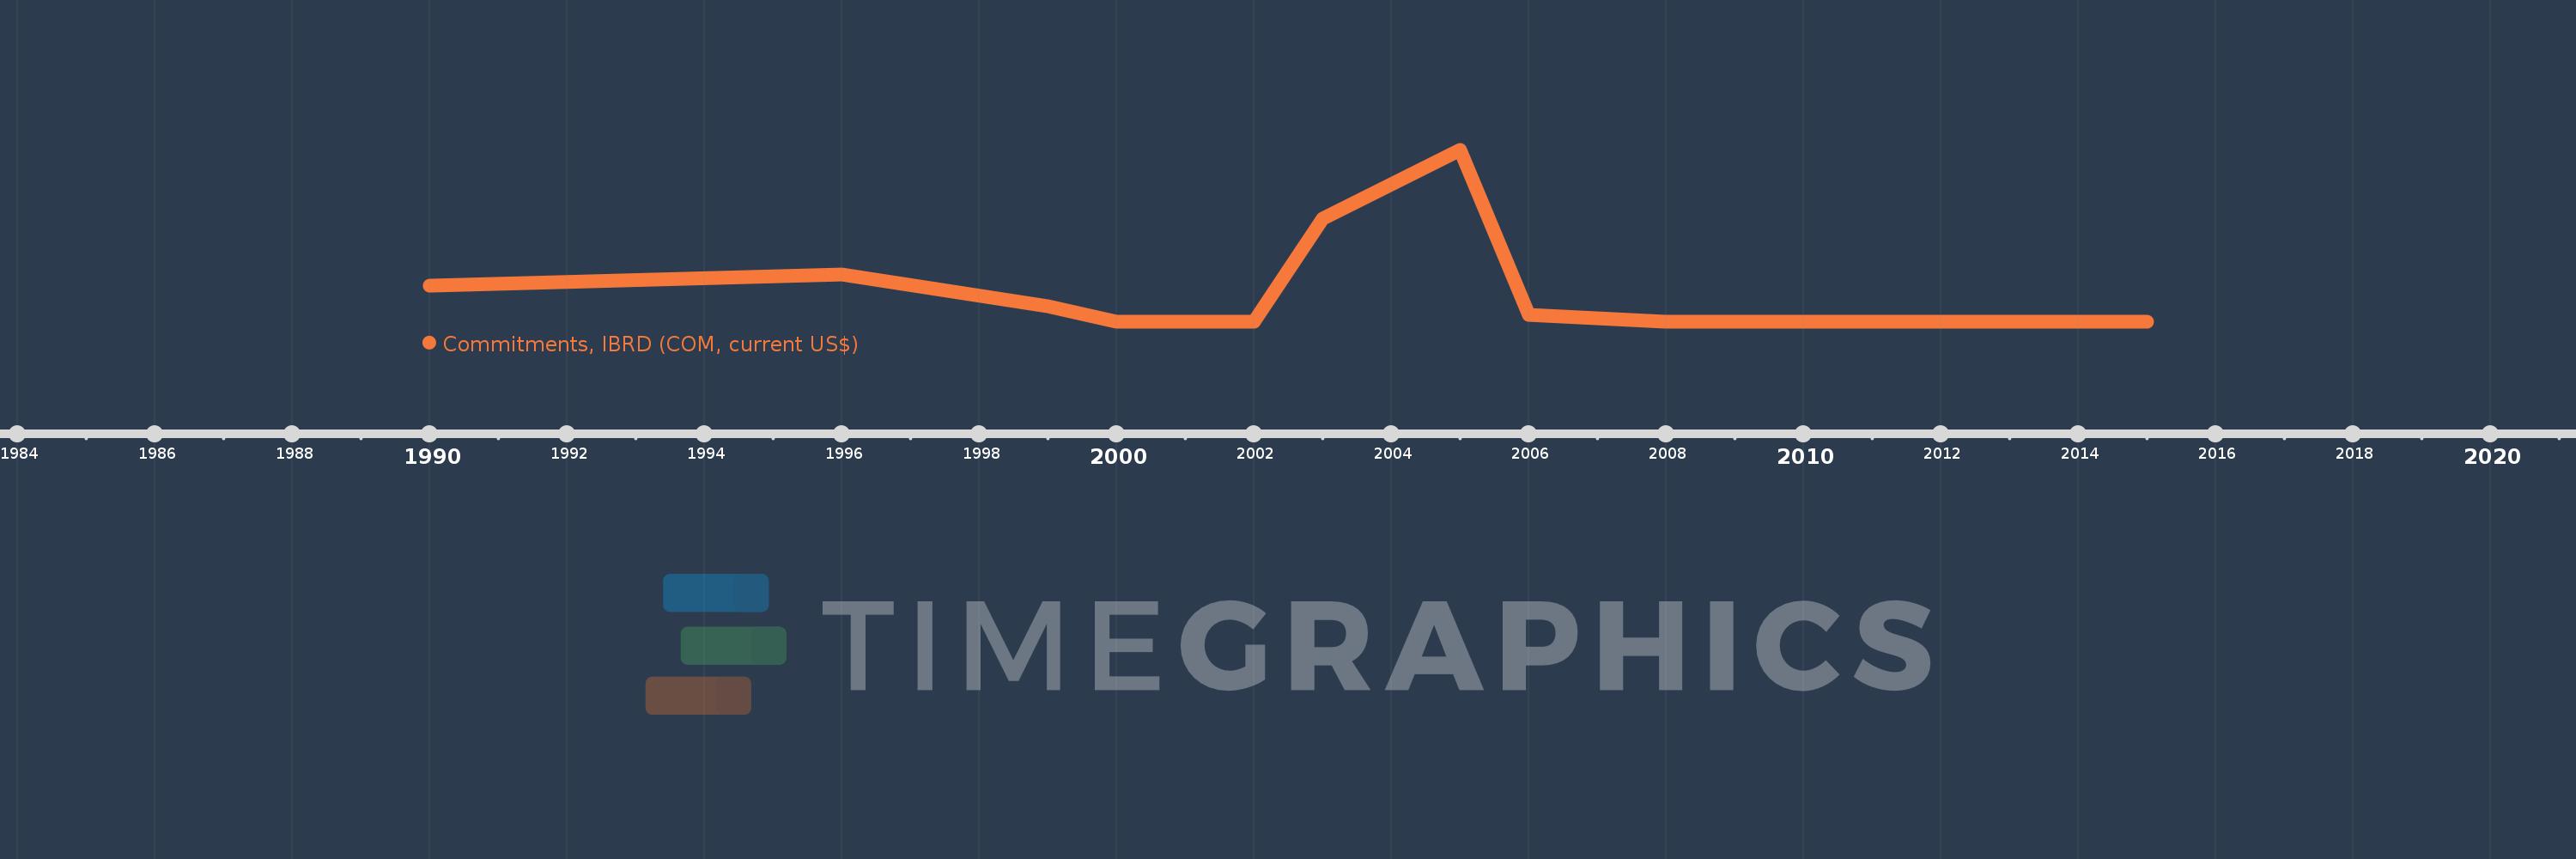
Commitments, IBRD (COM, current US$)
2015,2014,2013,2011,2010,2009,2008,2006,2005,2003,2002,2000,1999,1996,1990
This statistics in other country:
Timeline:
This timeline shows a graph from 1990 to 2015 of St. Vincent and the Grenadines. No data until 1989. Number of actual observations by date: 15.
Source name:
World Development Indicators
Source organization:
World Bank, International Debt Statistics.
Categories, topics:
External Debt
Last updated:
apr 23, 2017
Indicators value changes by year
Maximum:
6.6 mln
jan 1, 2005
At the date of observation
Value
Absolute change
Change from previous value
jan 1, 1990
1.4 mln
+1.4 mln
0.0%
jan 1, 1996
1.81 mln
+410.0K
29.29%
jan 1, 1999
600.0K
-1.21 mln
-66.85%
jan 1, 2000
0.0
-600.0K
-100.0%
jan 1, 2003
3.96 mln
+3.96 mln
%
jan 1, 2005
6.6 mln
+2.64 mln
66.67%
jan 1, 2006
272.0K
-6.328 mln
-95.88%
jan 1, 2008
0.0
-272.0K
-100.0%
Ranking of countries by current statistics by years


Comments: