29
/
en
AIzaSyAYiBZKx7MnpbEhh9jyipgxe19OcubqV5w
April 1, 2024
251229
St. Lucia
LCA
true
2
1
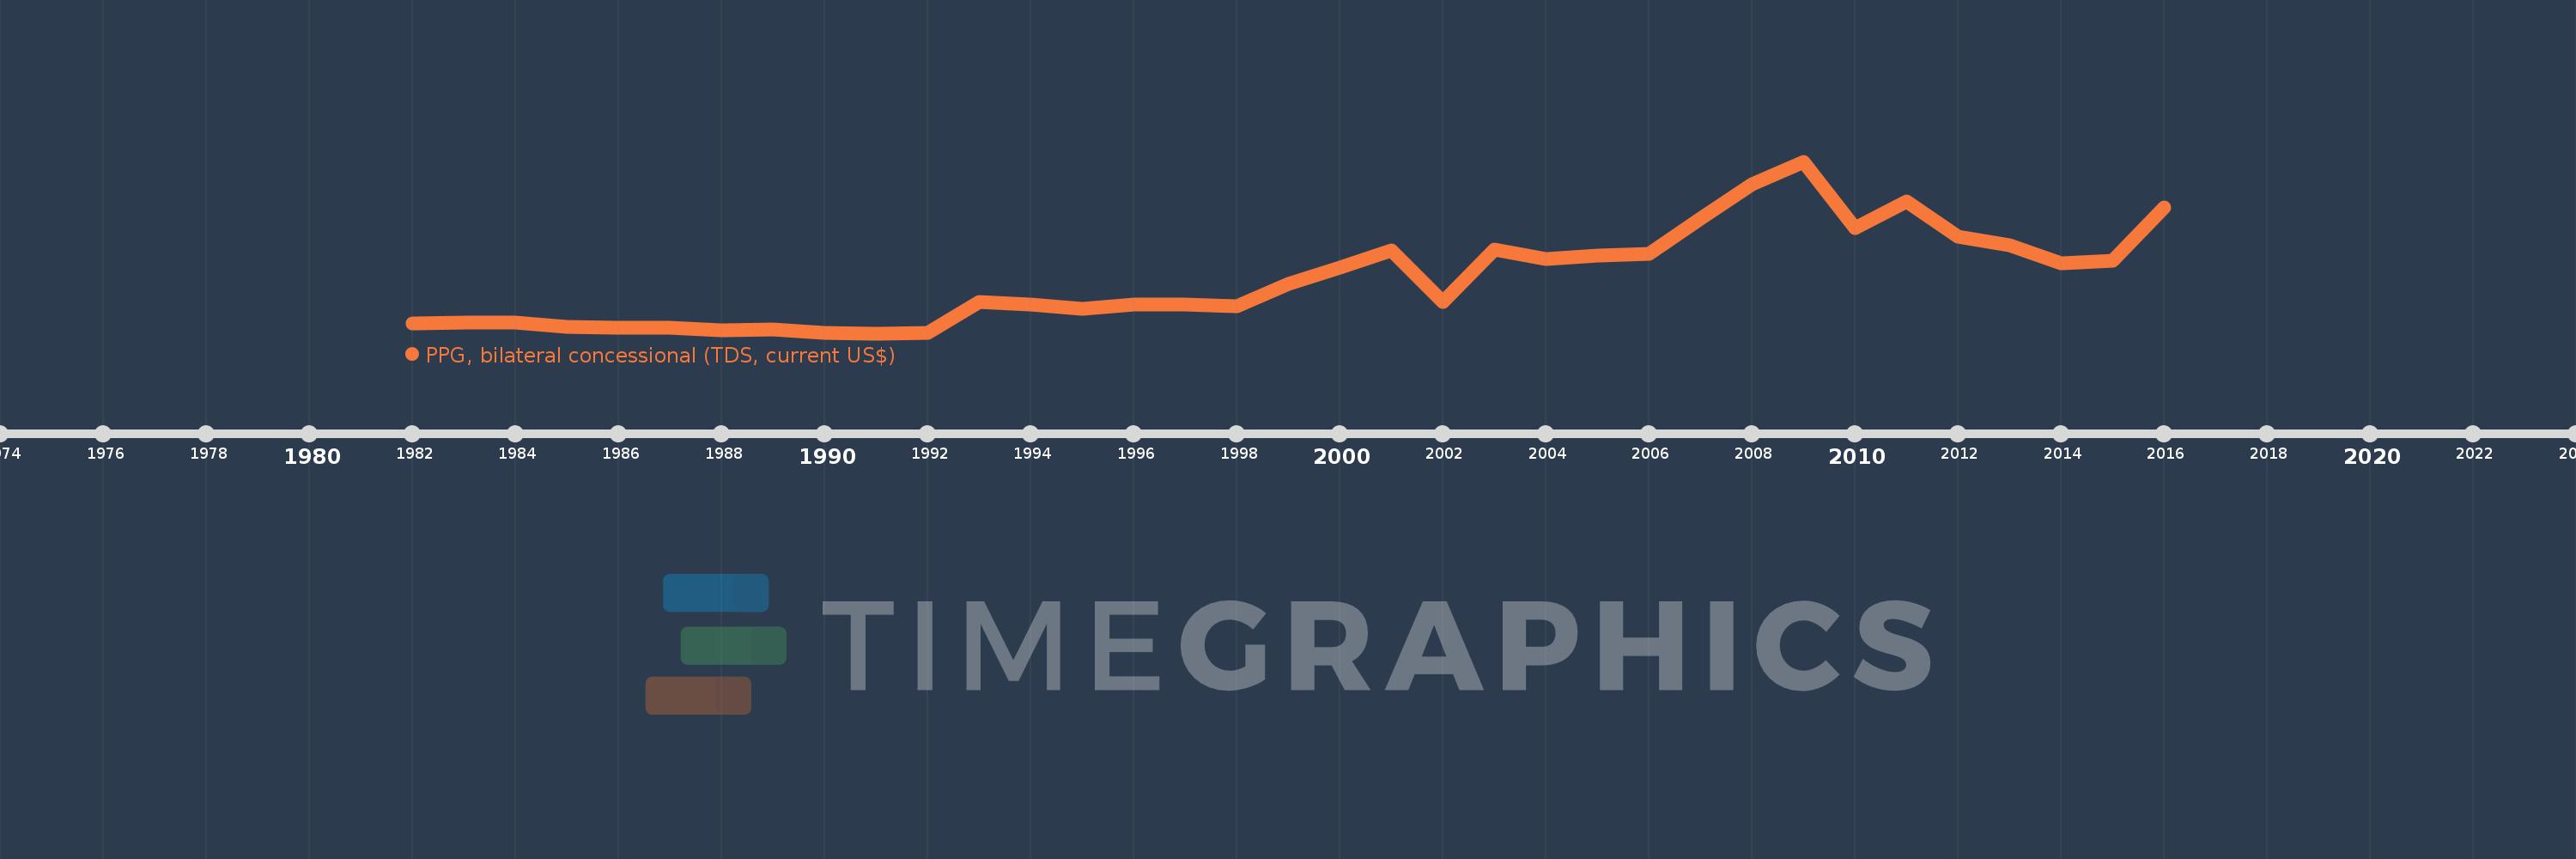
PPG, bilateral concessional (TDS, current US$)
2016,2015,2014,2013,2012,2011,2010,2009,2008,2007,2006,2005,2004,2003,2002,2001,2000,1999,1998,1997,1996,1995,1994,1993,1992,1991,1990,1989,1988,1987,1986,1985,1984,1983,1982
This statistics in other country:
Timeline:
This timeline shows a graph from 1982 to 2016 of St. Lucia. No data until 1981. Number of actual observations by date: 35.
Source name:
World Development Indicators
Source organization:
World Bank, International Debt Statistics.
Categories, topics:
External Debt
Last updated:
apr 23, 2017
Indicators value changes by year
Maximum:
5.996 mln
jan 1, 2009
At the date of observation
Value
Absolute change
Change from previous value
jan 1, 1982
379.0K
+379.0K
0.0%
jan 1, 1983
384.0K
+5.0K
1.32%
jan 1, 1984
383.0K
-1000.0
-0.26%
jan 1, 1985
246.0K
-137.0K
-35.77%
jan 1, 1986
220.0K
-26.0K
-10.57%
jan 1, 1987
206.0K
-14.0K
-6.36%
jan 1, 1988
114.0K
-92.0K
-44.66%
jan 1, 1989
146.0K
+32.0K
28.07%
jan 1, 1990
47.0K
-99.0K
-67.81%
jan 1, 1991
22.0K
-25.0K
-53.19%
jan 1, 1992
45.0K
+23.0K
104.55%
jan 1, 1993
1.122 mln
+1.077 mln
2.39K%
jan 1, 1994
1.021 mln
-101.0K
-9.0%
jan 1, 1995
868.0K
-153.0K
-14.99%
jan 1, 1996
1.034 mln
+166.0K
19.12%
jan 1, 1997
1.036 mln
+2.0K
0.19%
jan 1, 1998
949.0K
-87.0K
-8.4%
jan 1, 1999
1.743 mln
+794.0K
83.67%
jan 1, 2000
2.318 mln
+575.0K
32.99%
jan 1, 2001
2.913 mln
+595.0K
25.67%
jan 1, 2002
1.121 mln
-1.792 mln
-61.52%
jan 1, 2003
2.933 mln
+1.812 mln
161.64%
jan 1, 2004
2.602 mln
-331.0K
-11.29%
jan 1, 2005
2.715 mln
+113.0K
4.34%
jan 1, 2006
2.79 mln
+75.0K
2.76%
jan 1, 2007
3.998 mln
+1.208 mln
43.3%
jan 1, 2008
5.213 mln
+1.215 mln
30.39%
jan 1, 2009
5.996 mln
+783.0K
15.02%
jan 1, 2010
3.682 mln
-2.314 mln
-38.59%
jan 1, 2011
4.602 mln
+920.0K
24.99%
jan 1, 2012
3.376 mln
-1.226 mln
-26.64%
jan 1, 2013
3.071 mln
-305.0K
-9.03%
jan 1, 2014
2.458 mln
-613.0K
-19.96%
jan 1, 2015
2.535 mln
+77.0K
3.13%
jan 1, 2016
4.392 mln
+1.857 mln
73.25%
Ranking of countries by current statistics by years


Comments: