29
/
en
AIzaSyAYiBZKx7MnpbEhh9jyipgxe19OcubqV5w
April 1, 2024
247294
Spain
ESP
true
2
1
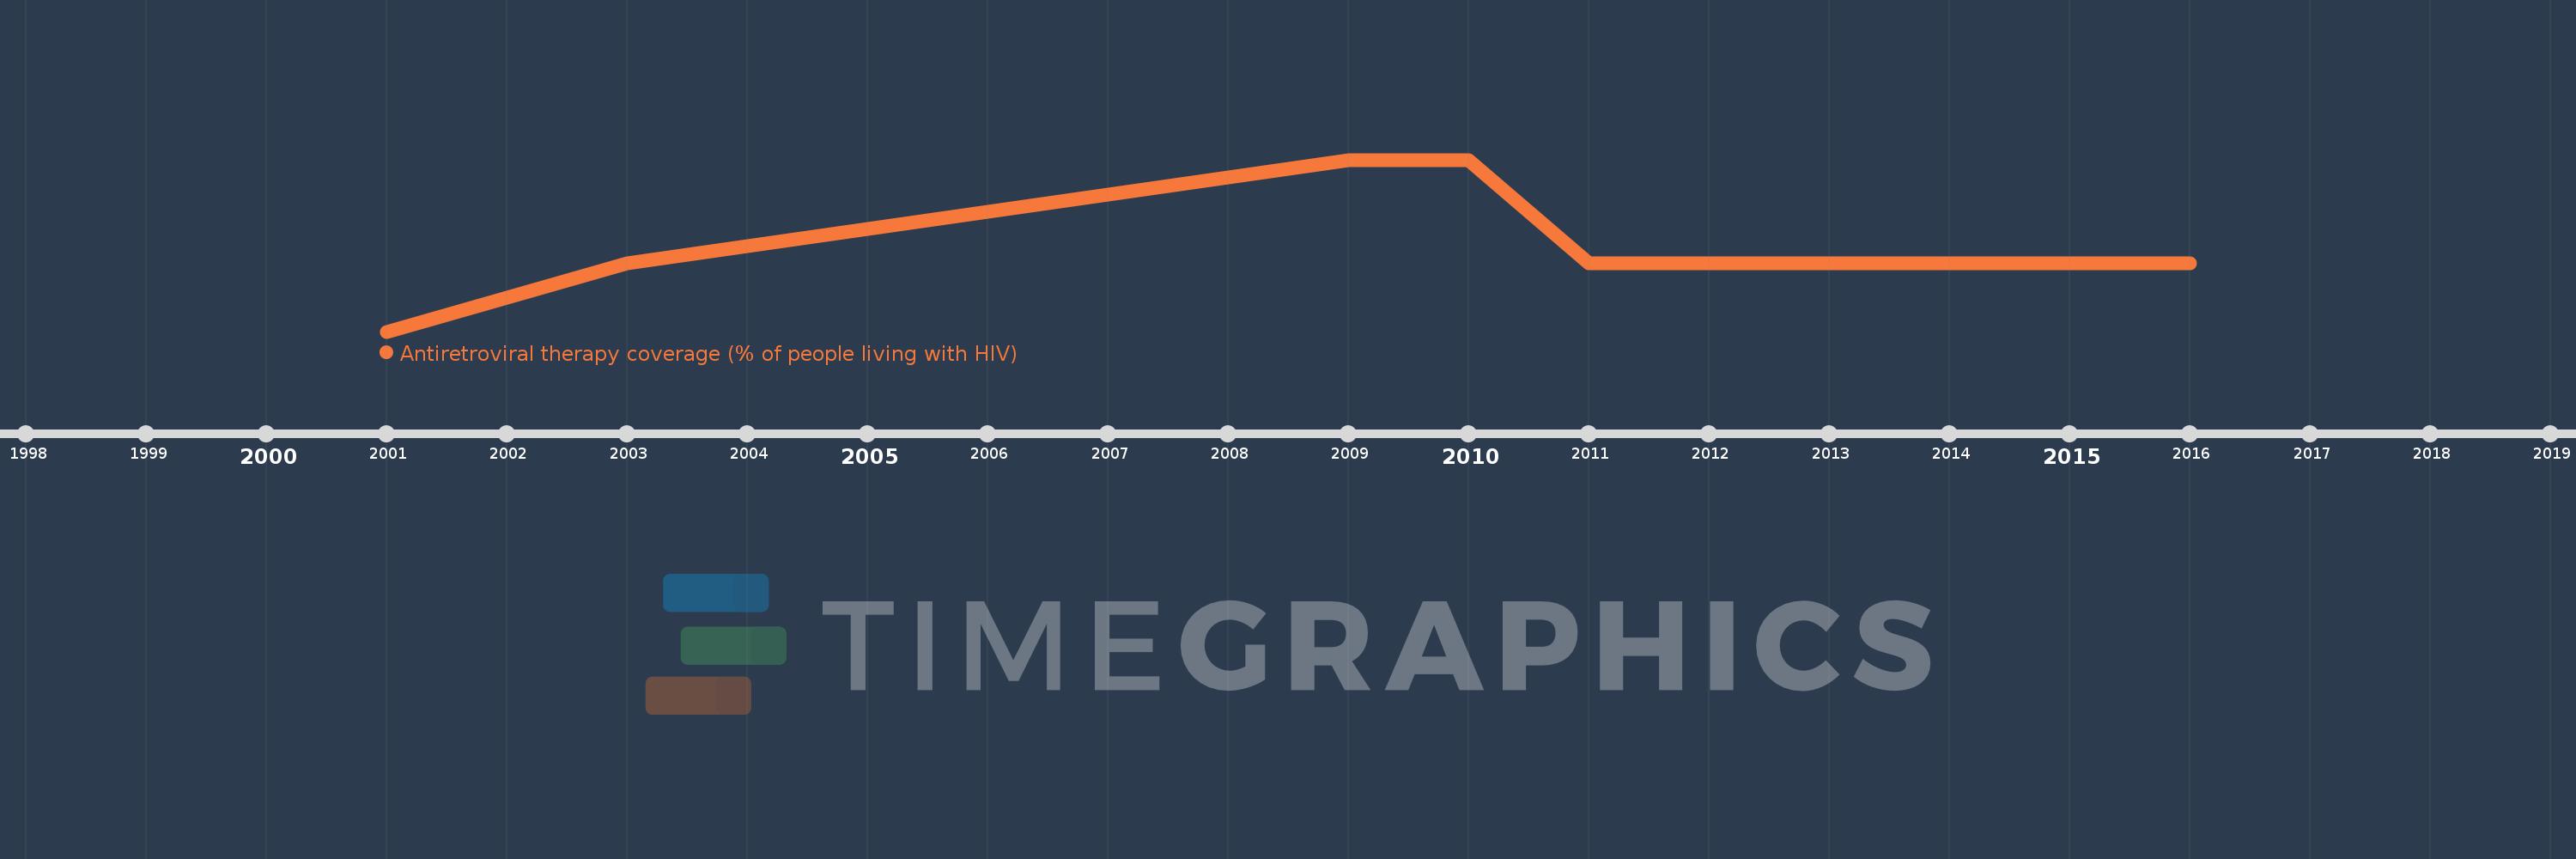
Antiretroviral therapy coverage (% of people living with HIV)
2016,2015,2014,2013,2012,2011,2010,2009,2008,2007,2006,2005,2004,2003,2002,2001
This statistics in other country:
Timeline:
This timeline shows a graph from 2001 to 2016 of Spain. No data until 2000. Number of actual observations by date: 16.
Source name:
World Development Indicators
Source organization:
UNAIDS estimates.
Categories, topics:
Health
Last updated:
apr 23, 2017
Indicators value changes by year
At the date of observation
Value
Absolute change
Change from previous value
jan 1, 2001
70.0
+70.0
0.0%
jan 1, 2002
72.0
+2.0
2.86%
jan 1, 2003
74.0
+2.0
2.78%
jan 1, 2004
75.0
+1.0
1.35%
jan 1, 2005
76.0
+1.0
1.33%
jan 1, 2006
77.0
+1.0
1.32%
jan 1, 2007
78.0
+1.0
1.3%
jan 1, 2008
79.0
+1.0
1.28%
jan 1, 2009
80.0
+1.0
1.27%
jan 1, 2011
74.0
-6.0
-7.5%
Ranking of countries by current statistics by years


Comments: