29
/
en
AIzaSyAYiBZKx7MnpbEhh9jyipgxe19OcubqV5w
April 1, 2024
246188
South Africa
ZAF
true
2
1
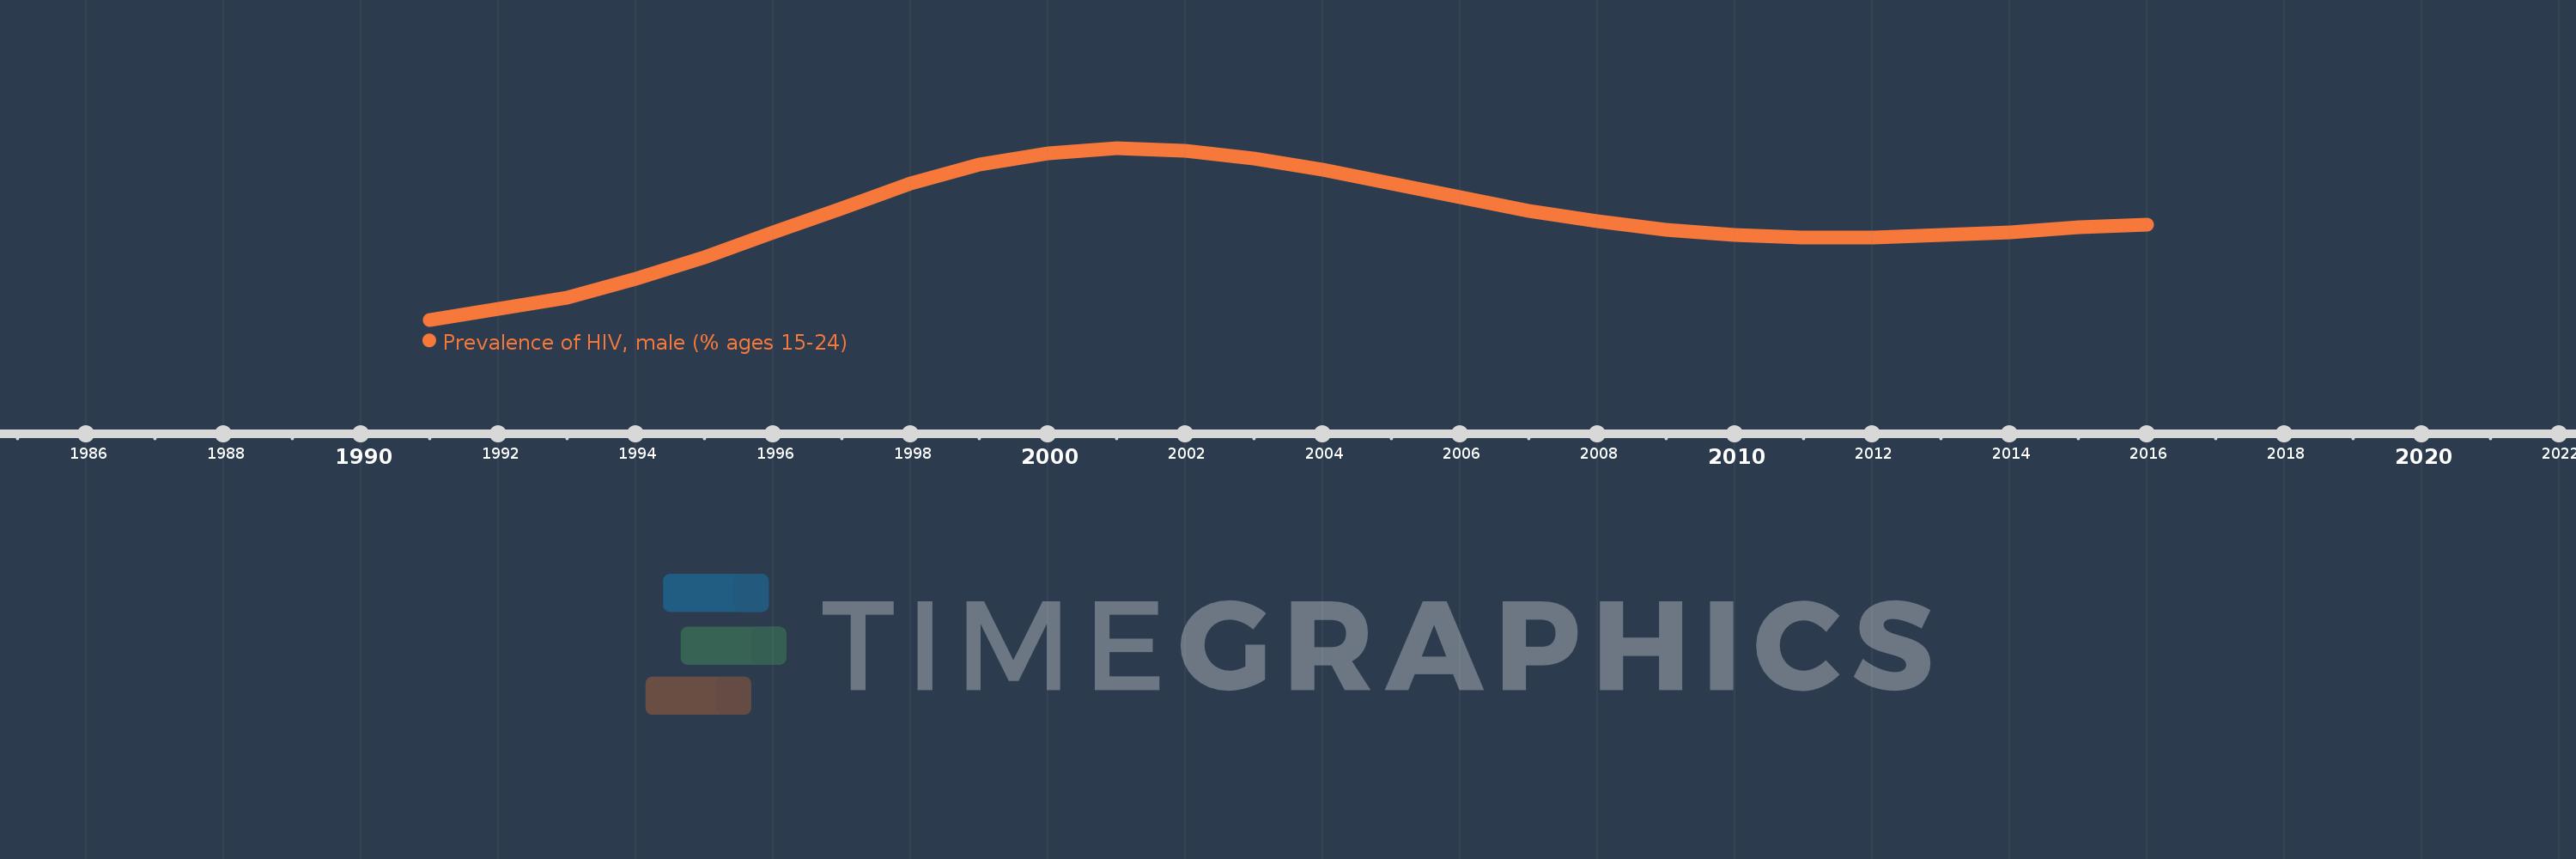
Prevalence of HIV, male (% ages 15-24)
2016,2015,2014,2013,2012,2011,2010,2009,2008,2007,2006,2005,2004,2003,2002,2001,2000,1999,1998,1997,1996,1995,1994,1993,1992,1991
This statistics in other country:
Timeline:
This timeline shows a graph from 1991 to 2016 of South Africa. No data until 1990. Number of actual observations by date: 26.
Source name:
World Development Indicators
Source organization:
UNAIDS estimates.
Categories, topics:
Health, Gender, Social Development
Last updated:
apr 23, 2017
Indicators value changes by year
At the date of observation
Value
Absolute change
Change from previous value
jan 1, 1992
0.9
+0.4
80.0%
jan 1, 1993
1.3
+0.4
44.44%
jan 1, 1994
2.0
+0.7
53.85%
jan 1, 1995
2.8
+0.8
40.0%
jan 1, 1996
3.7
+0.9
32.14%
jan 1, 1997
4.6
+0.9
24.32%
jan 1, 1998
5.5
+0.9
19.57%
jan 1, 1999
6.2
+0.7
12.73%
jan 1, 2000
6.6
+0.4
6.45%
jan 1, 2001
6.8
+0.2
3.03%
jan 1, 2002
6.7
-0.1
-1.47%
jan 1, 2003
6.4
-0.3
-4.48%
jan 1, 2004
6.0
-0.4
-6.25%
jan 1, 2005
5.5
-0.5
-8.33%
jan 1, 2006
5.0
-0.5
-9.09%
jan 1, 2007
4.5
-0.5
-10.0%
jan 1, 2008
4.1
-0.4
-8.89%
jan 1, 2009
3.8
-0.3
-7.32%
jan 1, 2010
3.6
-0.2
-5.26%
jan 1, 2011
3.5
-0.1
-2.78%
jan 1, 2013
3.6
+0.1
2.86%
jan 1, 2014
3.7
+0.1
2.78%
jan 1, 2015
3.9
+0.2
5.41%
jan 1, 2016
4.0
+0.1
2.56%
Ranking of countries by current statistics by years


Comments: